Gallery: Chapter 3
Gallery: Chapter 3

Figure 3-1
Image of a dark, star-filled sky including a view of the stately disk of the Milky Way.

Figure 3-2a
Kepler-11b, the iconic compact multiple planet system, with six planets orbiting interior to where Venus’ orbit would be. Credit: NASA.
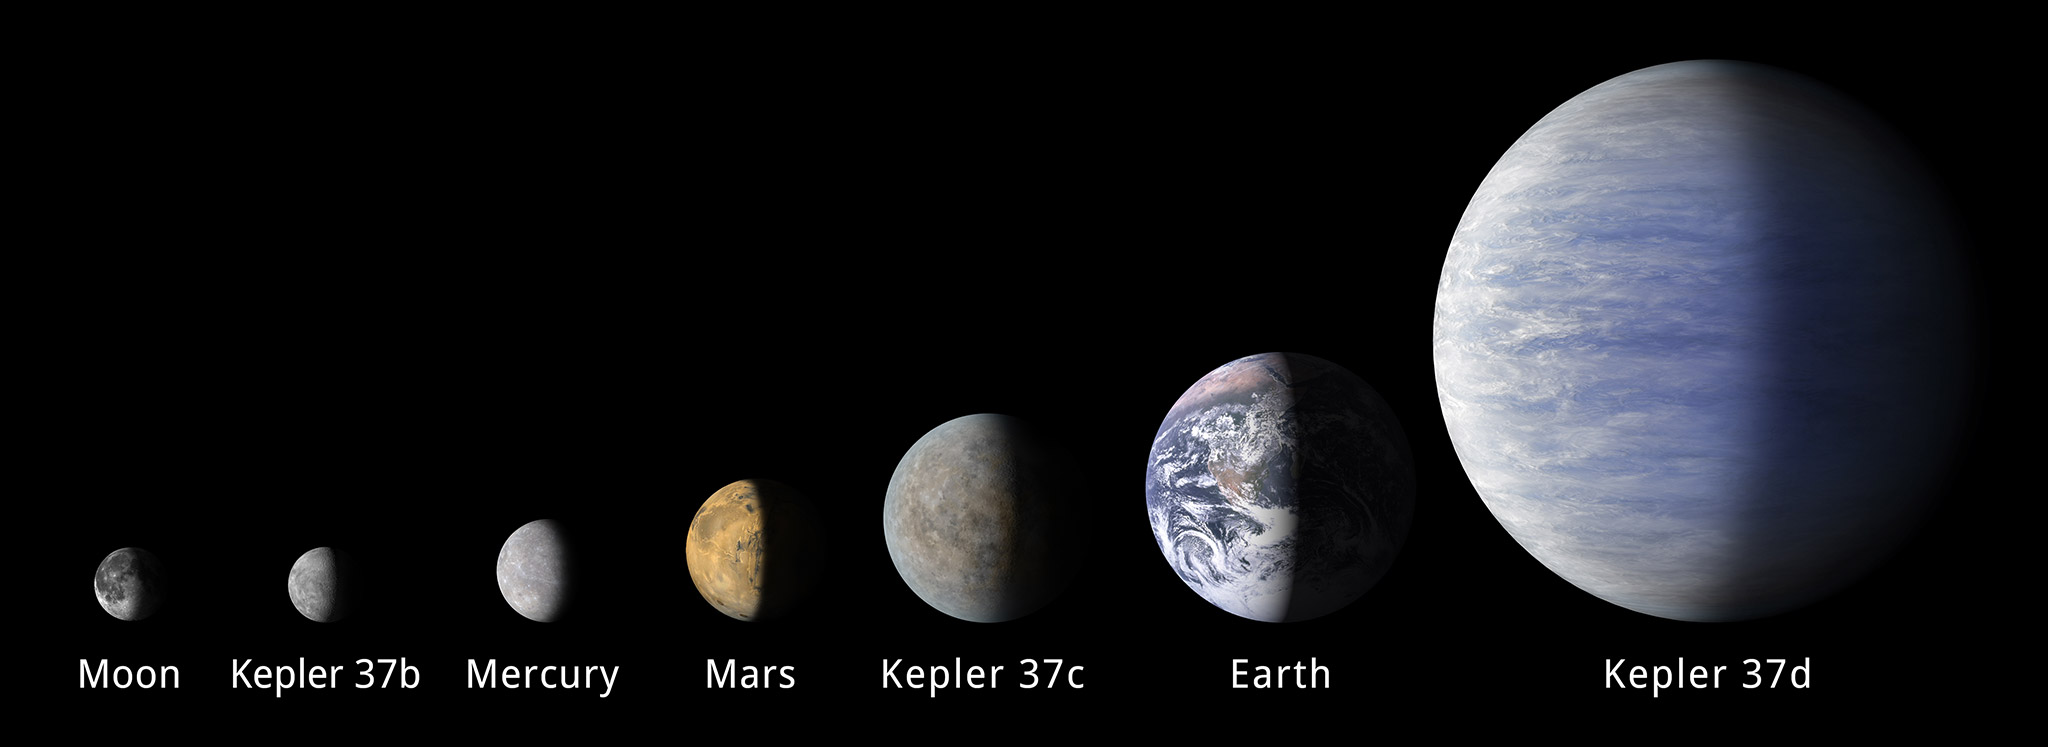
Figure 3-2b
The Moon-sized exoplanet Kepler-37b in comparison to other small planets. Credit: NASA.
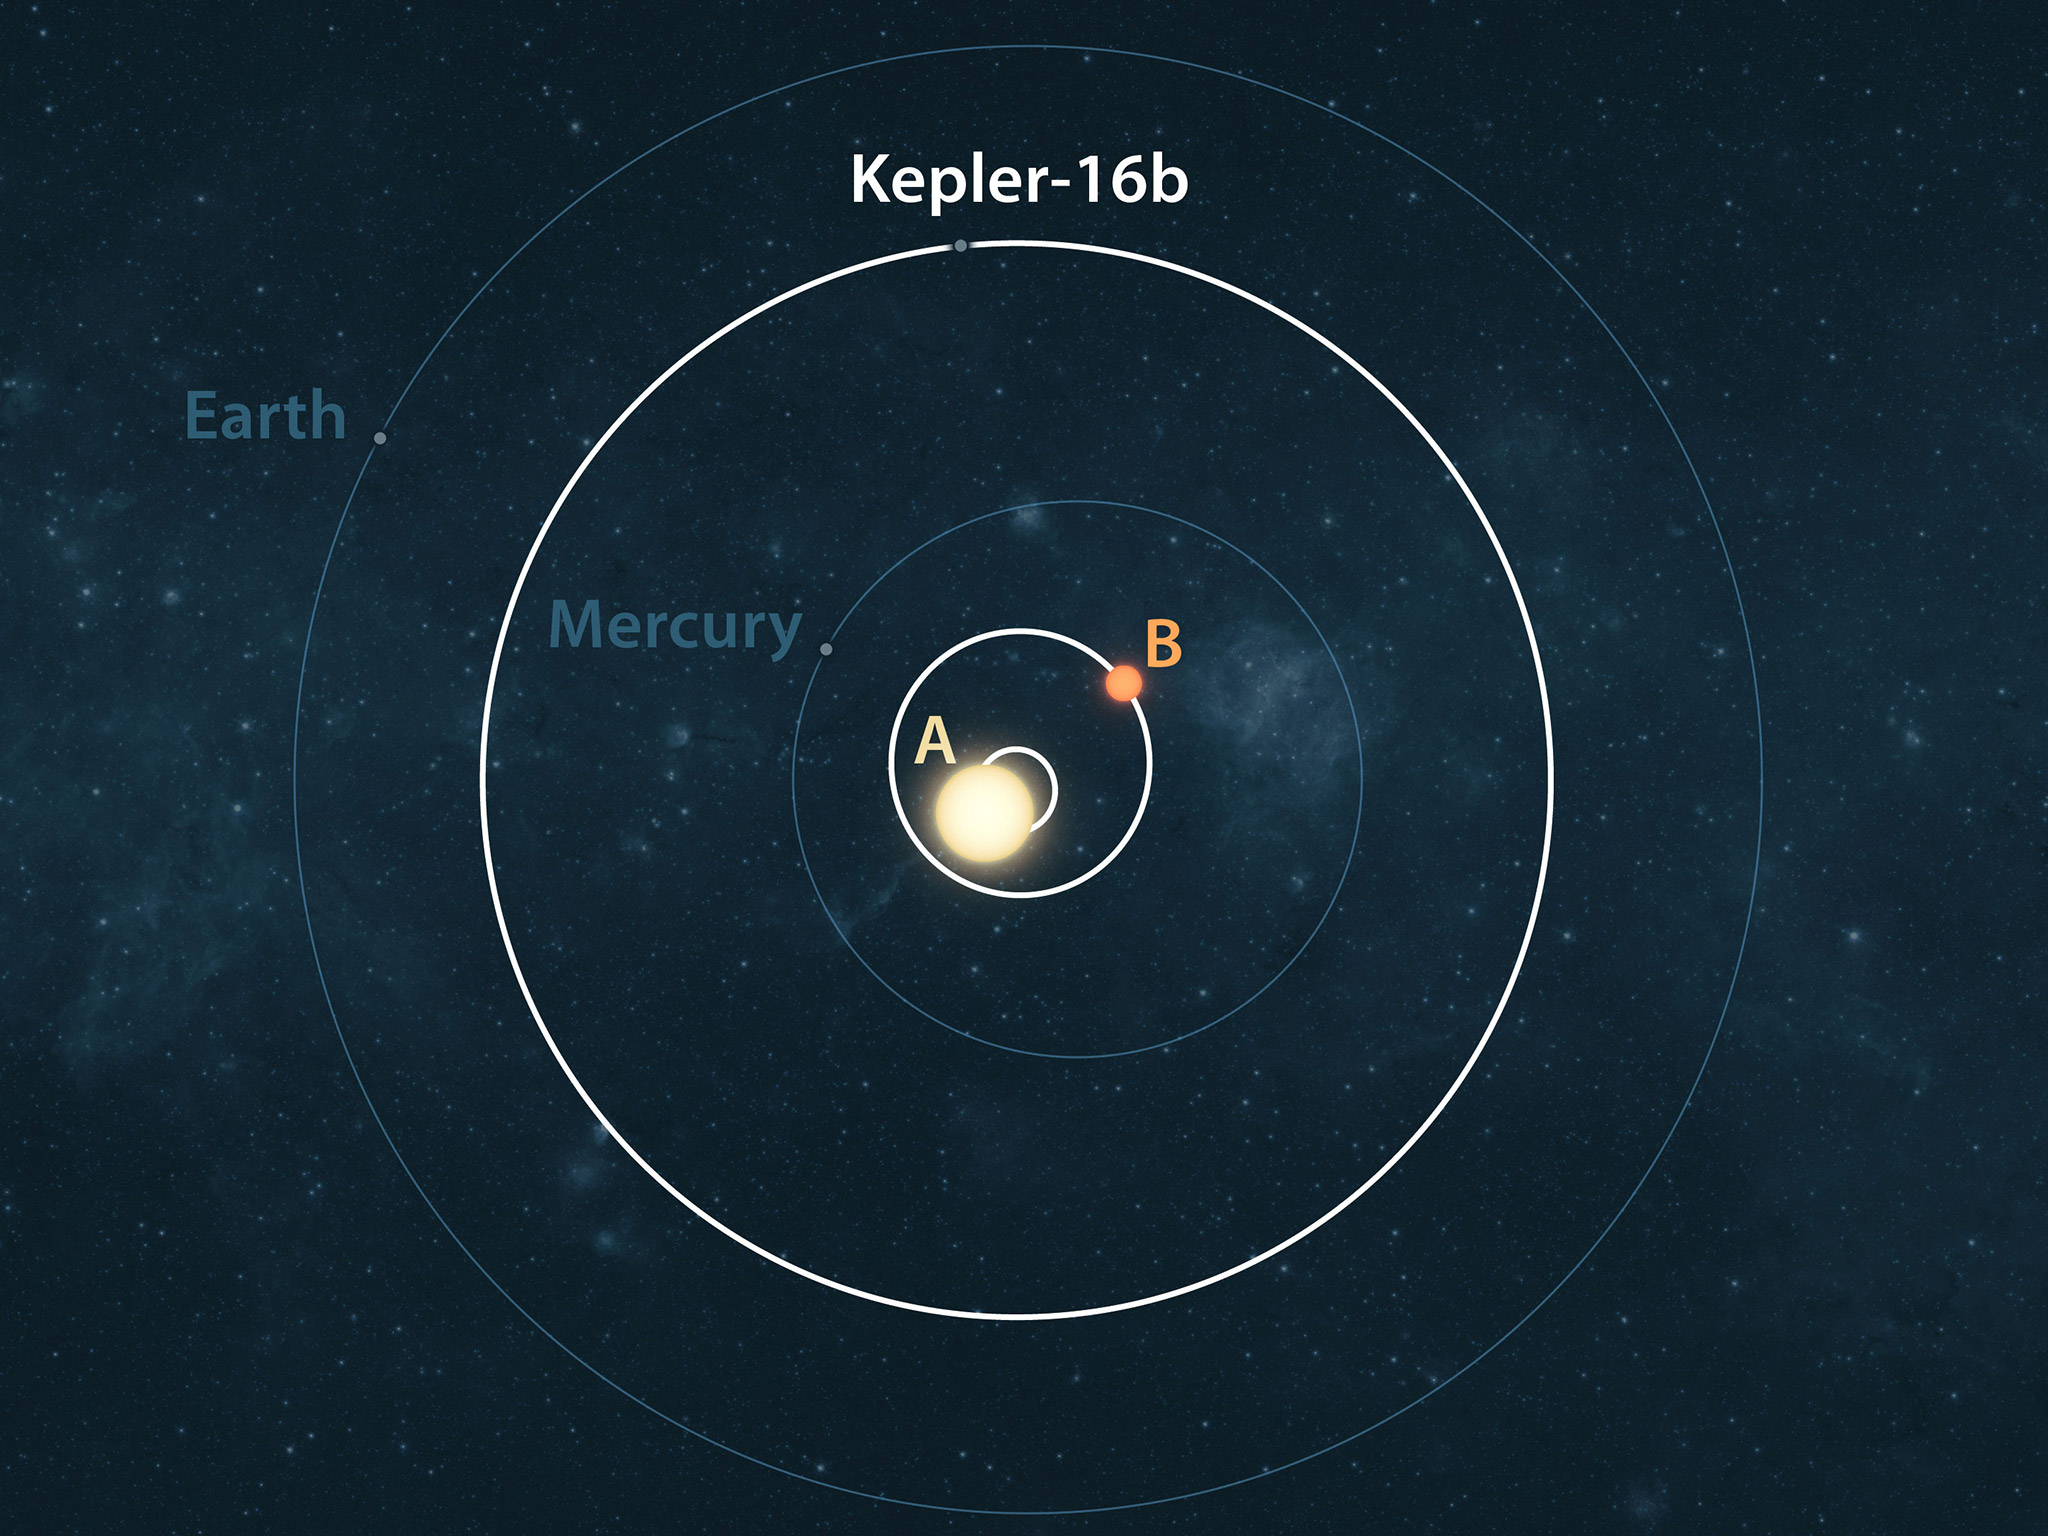
Figure 3-2c
The circumbinary planet Kepler-16b from an overhead view. The eccentric orbits of the two stars Kepler 16A and 16B are also shown. Credit: NASA.
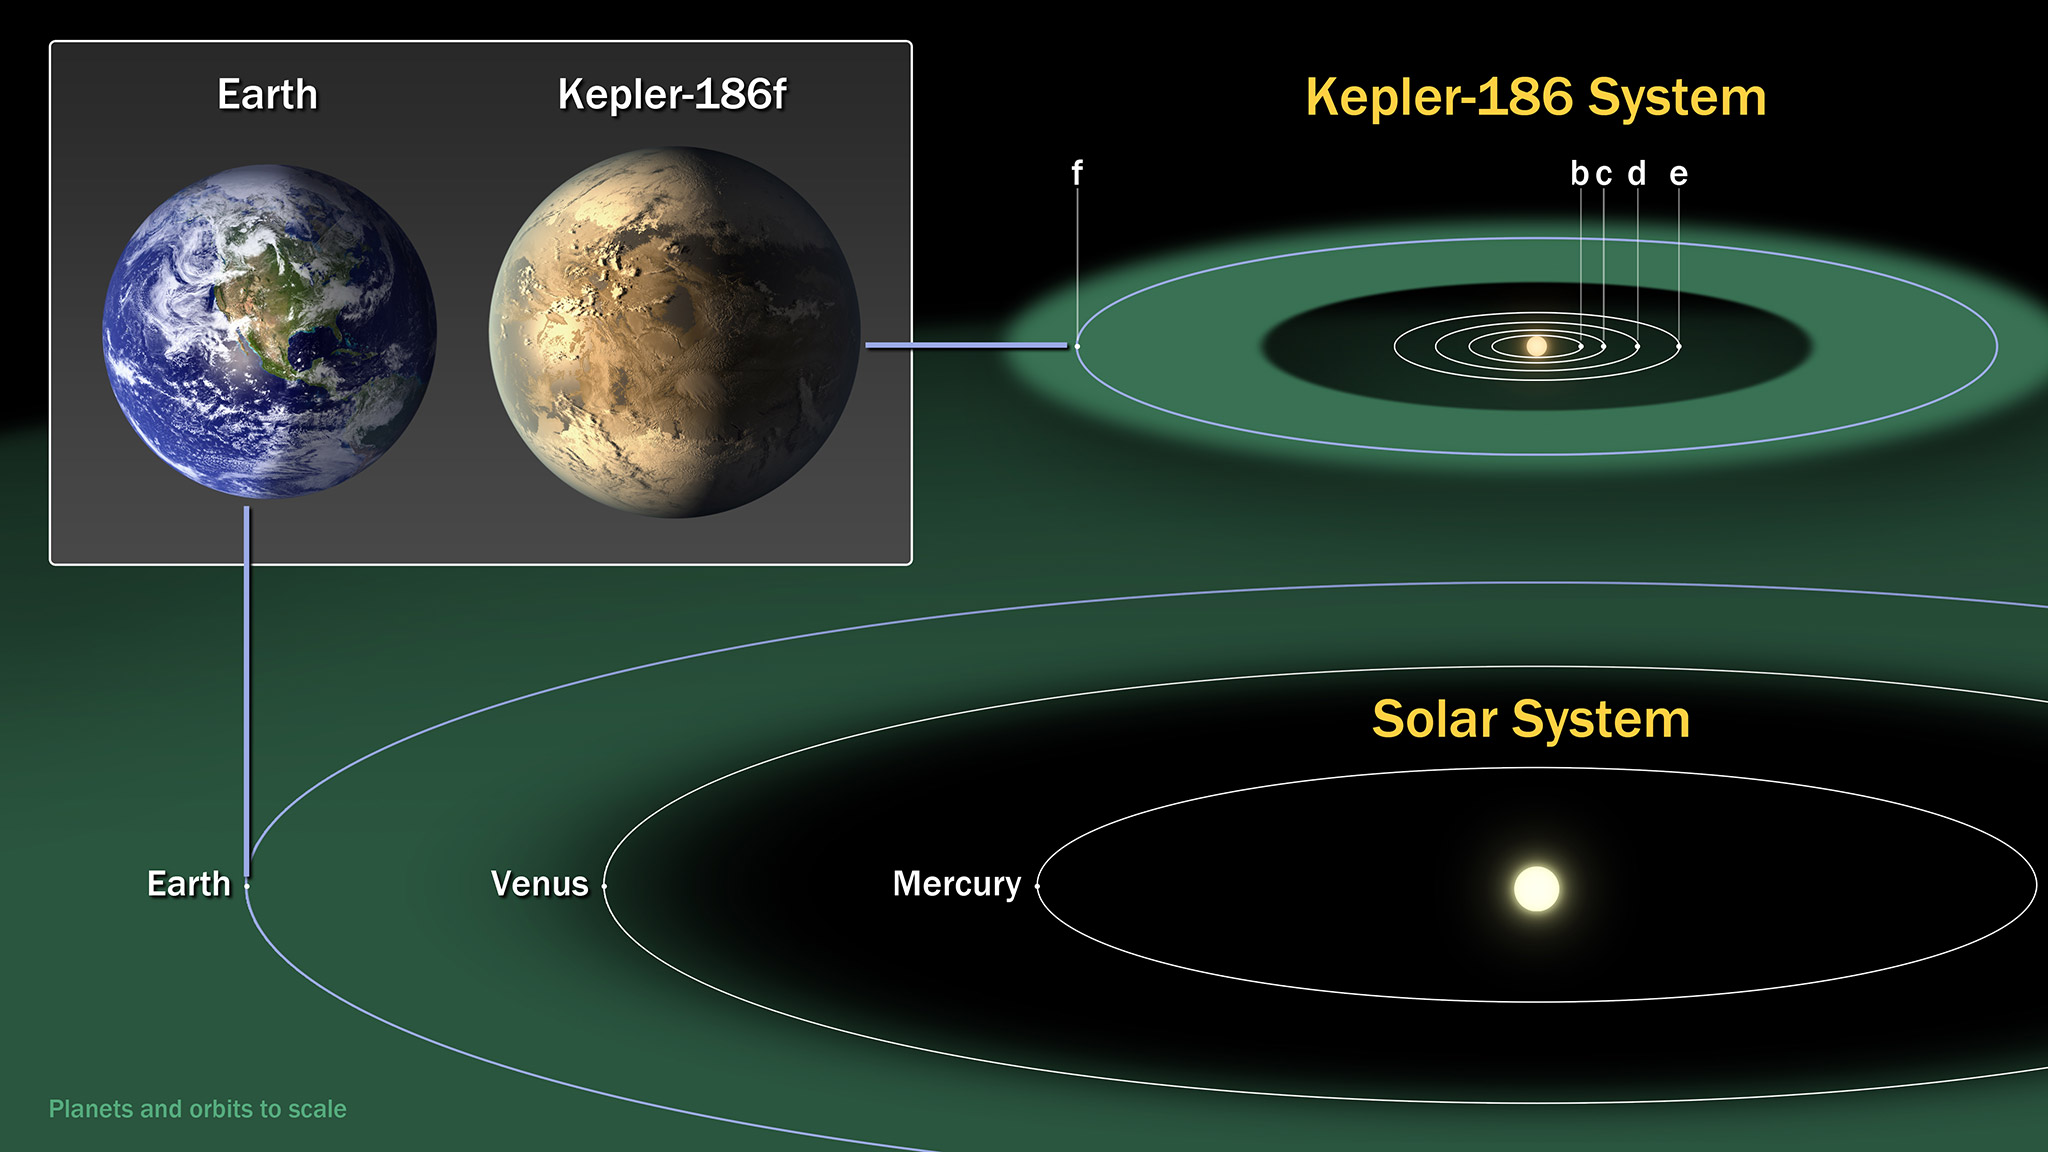
Figure 3-2d
Comparison of the planets in our inner Solar System to those in Kepler 186, a five-planet star system with an M dwarf host star, a star that is half the size and mass of the Sun. Credit: NASA.
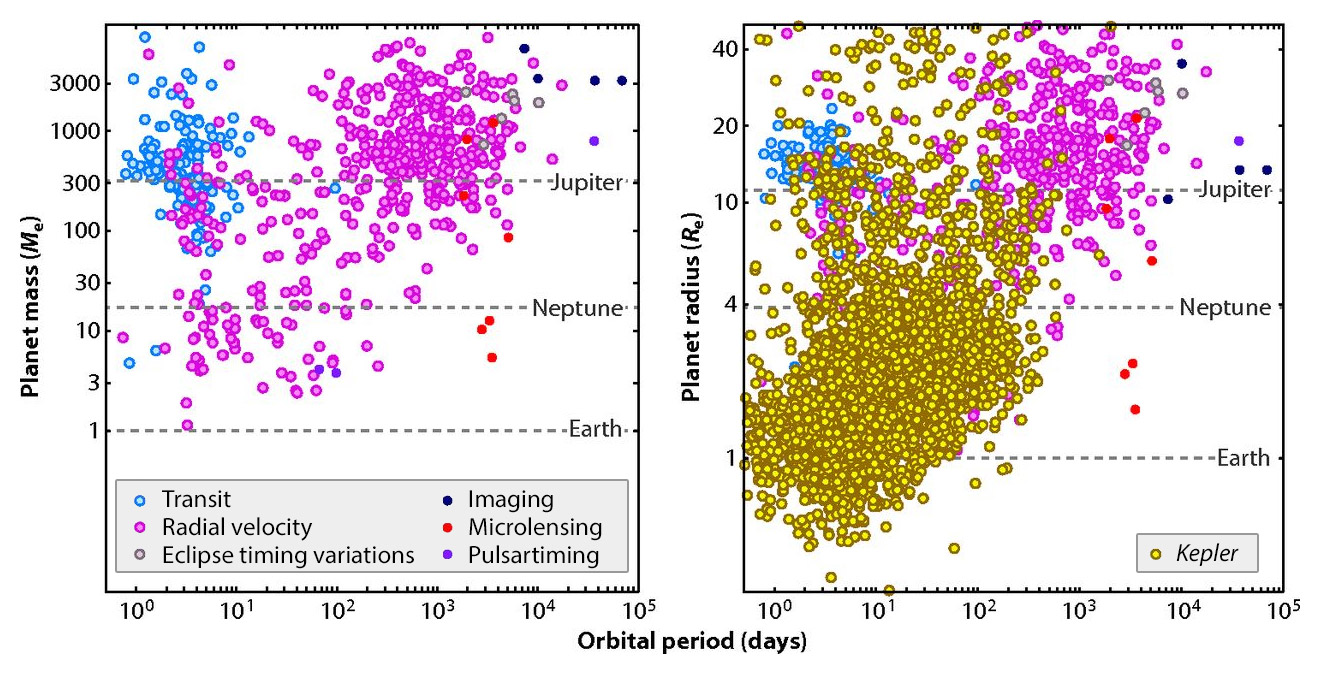
Figure 3-3
Exoplanet discovery space as of 2014. Data points are color-coded according to the planet discovery technique. Plotted as mass vs. orbital period (left) but excluding Kepler discoveries. Plotted as radius vs. orbital period (right, using a simplified mass-radius relationship to transform planet mass to radius where needed). A large number of exoplanets and planet candidates are known, but the Earth-size exoplanets in Earth-like orbits still reside in an open part of discovery space. Figure from Batalha (2014).
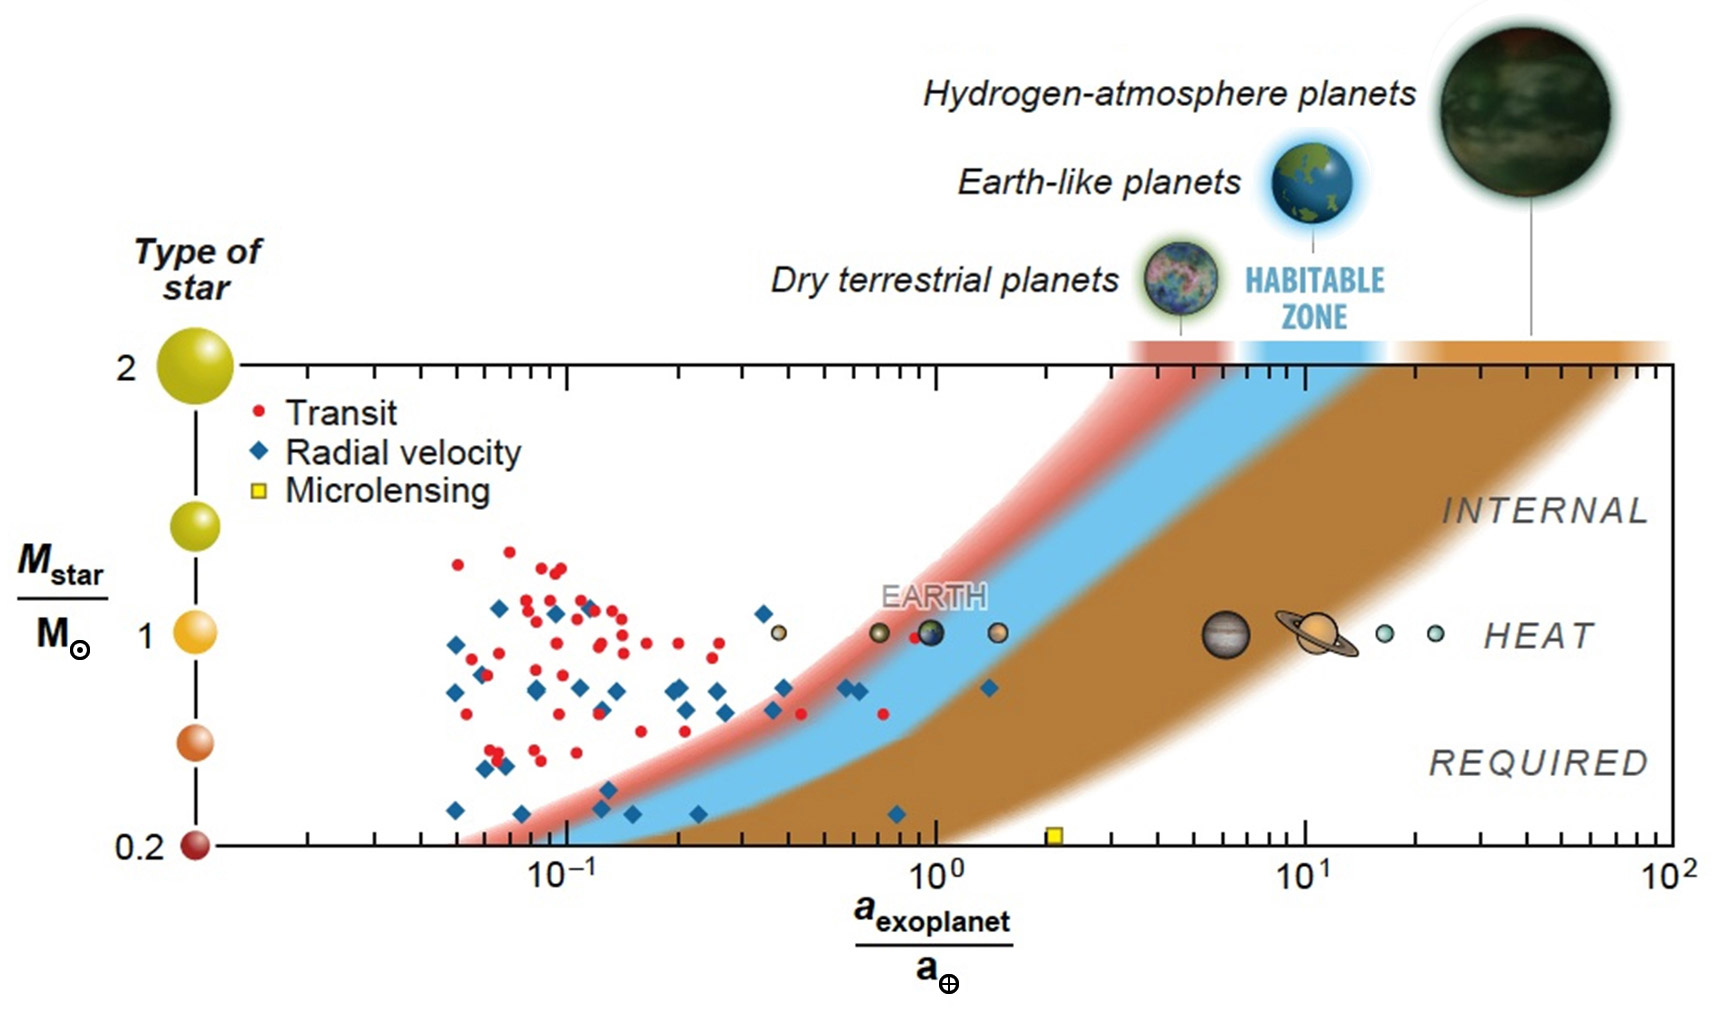
Figure 3-4
Planets in the habitable zone. The Solar System planets are shown with images. Known super-Earths (here planets with a mass or minimum mass less than 10 Earth masses; taken from Rein 2012) are shown as color-coded data points. The light blue region depicts the “conventional” habitable zone for N₂-CO₂-H₂O atmospheres. The habitable zone could indeed be much wider, depending on the planet’s atmospheric properties. The red region shows the habitable zone as extended inward for dry planets, with minimal surface water, a low water-vapor atmospheric abundance, and low atmospheric relative humidity and hence a smaller greenhouse effect. The brown region shows the outer extension of the habitable zone for planets that are massive and cold enough to hold onto molecular hydrogen—a potent greenhouse gas. The habitable zone might even extend out to free-floating planets with no host star. Figure from Seager (2013).

Figure 3-5
The variety of exoplanets as illustrated by their masses and orbital semi-major axes. Different exoplanet-finding techniques’ discovery spaces and discovered planets are indicated by colors. Many more exoplanets are known that do not have measured masses (see Figure 3-3). The anticipated parameter space accessible with HDST is shown in dark green. Figure adapted from Gaudi and Henderson (private communication) and Wright and Gaudi (2013).

Figure 3-6
Direct imaging contrast capabilities of current and future instrumentation. Shown are the 5-σ contrast limits after post-processing one hour’s worth of data for various coronagraph instruments. As can be seen in the plot, there are roughly three groupings of curves: 1) state-of-the art instruments in the early 2010s, as represented by Keck near-IRC2, the Palomar Well-Corrected Subaperture, and VLT-NaCo; 2) newly operational state-of-the-art instruments, represented by P1640, GPI, and VLTI-SPHERE; and 3) future extremely large telescopes, represented by TMT PFI and E-ELT EPICS. The contrast curves for JWST NIRCam and Hubble/ACS are shown for reference. On the top right of the figure are plotted the K-band contrasts of some of the giant exoplanets imaged to date. In the lower part of the figure are plotted our Solar System planets as they would appear in reflected light around a Sun-like star at a distance of 10 pc. The left side of the plot shows the corresponding RMS wavefront error for a coronagraph using a 64 × 64 element deformable mirror. The region above the solid red line would be probed by HDST. The gray region in the lower left of the figure shows the predicted locus of terrestrial habitable zone planets for F-G-K (Solar-like) stars. Figure and caption adapted from Lawson et al. (2012), Mawet et al. (2012), and Stapelfeldt (private communication 2015).

Figure 3-7
Schematic of a transiting exoplanet. Figure credit: D. Beckner.
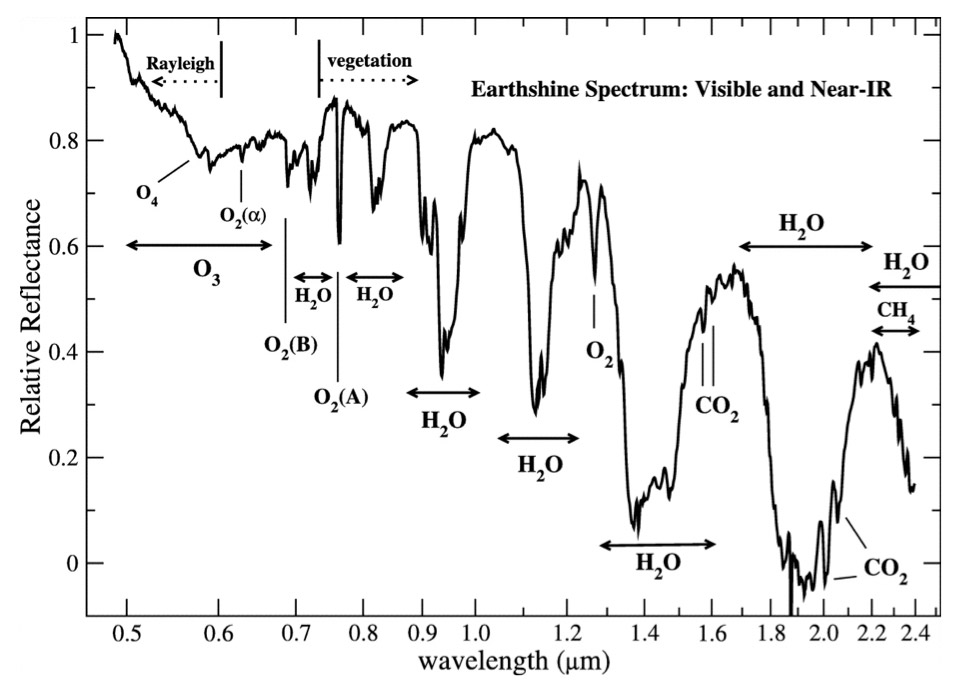
Figure 3-8
Earth’s observed reflectance spectrum at visible and near-IR wavelengths. From Earthshine measurements (Turnbull et al. 2006), the spectrum is disk-integrated, i.e., spatially unresolved and shows what Earth would like to a distant observer. The reflectance is normalized to one; the relatively high continuum and the presence of water vapor, oxygen, and ozone at visible wavelengths are relevant.
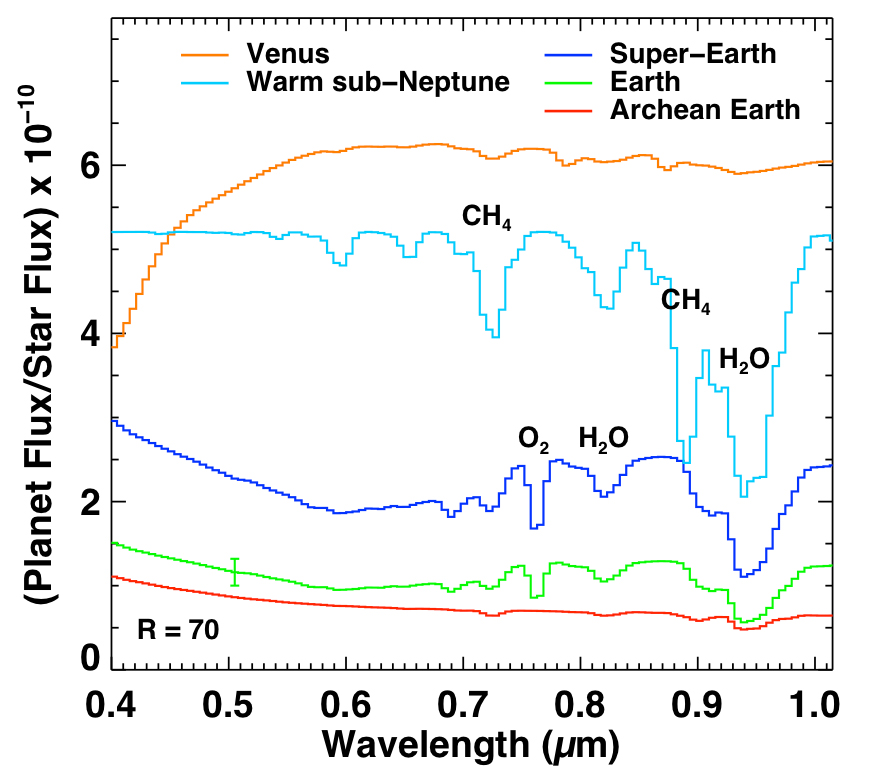
Figure 3-9
Simulated spectra of small planets orbiting a Sun-like star. The Earth, Venus, Archean Earth, and super-Earth models are from the Virtual Planet Laboratory. The sub-Neptune model is from R. Hu (personal communication). The Earth, super-Earth, and Archean Earth are at 1 AU. Venus is at its 0.75 AU. The sub Neptune is at 2 AU. The spectra have been convolved to R = 70 spectral resolution and re-binned onto a wavelength grid with 11 nanometer bins. Figure courtesy of A. Roberge.

Figure 3-10
The exoEarth sample size, NEC, required to ensure detection of at least one exoEarth with evidence for habitability (or even biosignature gases) as a function of the fraction of exoEarths with such detectable features.These results are computed using the binomial theorem (see equation in figure) where C is the probability of detecting at least one life-bearing exoEarth in the sample, η⊕ is the eta Earth value (taken to be 0.1 for this computation), and ηx is the fraction of exoEarths with detectable biosignature gases. Shown are the lines for three commonly used probabilities: 68%, 95%, and 99.7%. Image credit: C. Stark

Figure 3-11
Planet occurrence as a function of planet size and planet orbital period. Kepler-detected small planets are shown by red circles. While the detected planets show the transit discovery technique’s bias towards larger, shorter-period planets, the occurrence rates provided in each bin are corrected for biases. Figure adapted from Petigura et al. (2013).
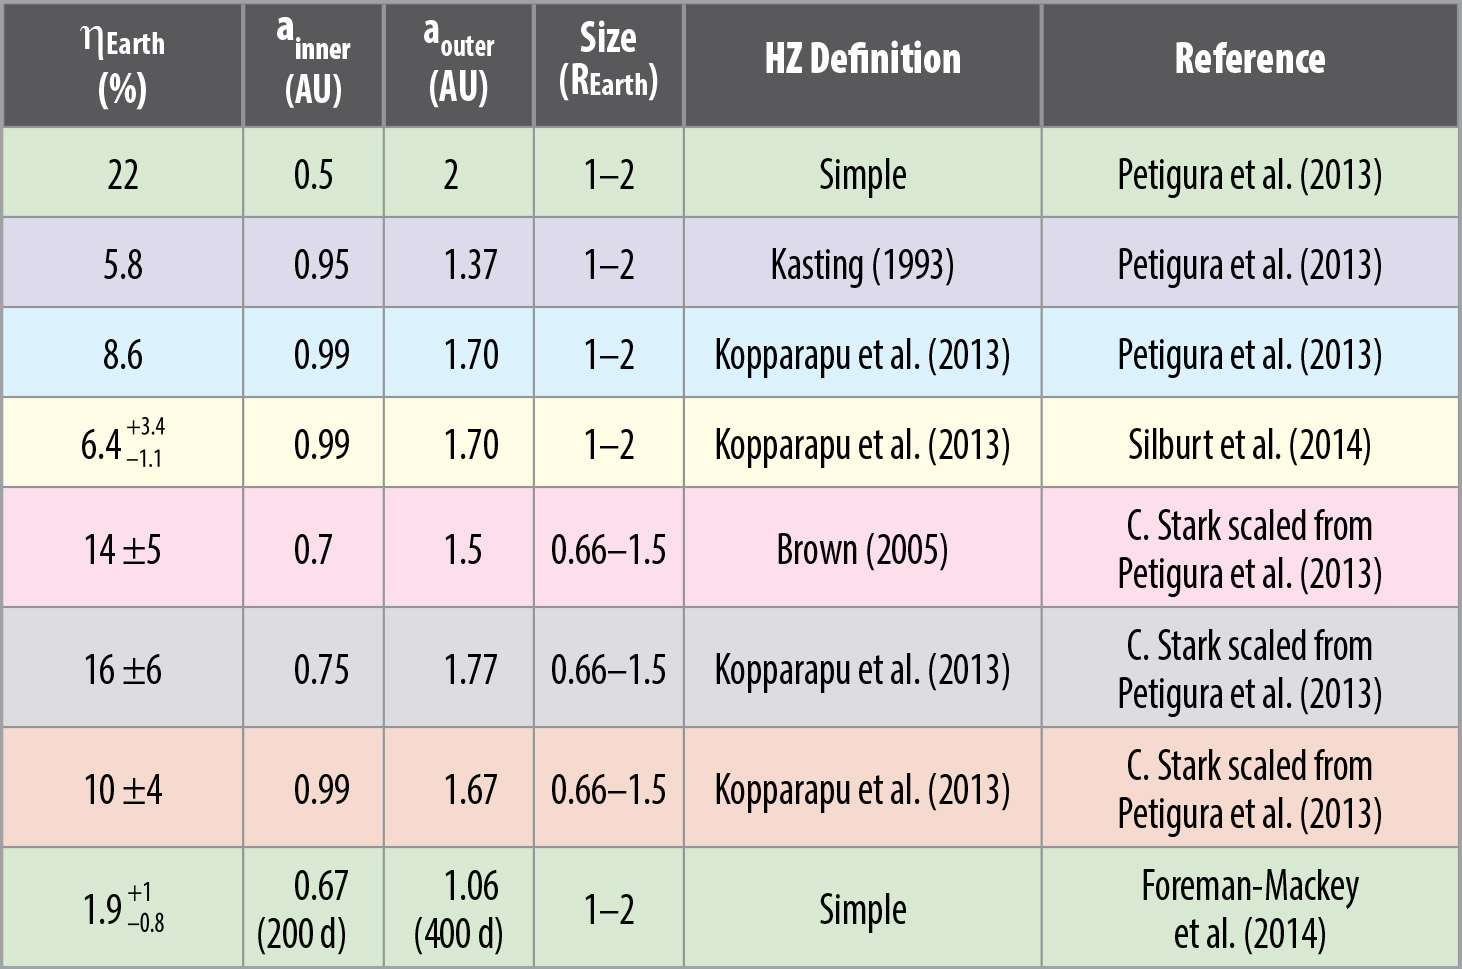
Table 3-1
Values of ηEarth for Sun-like stars under different HZ and Earth-size radius assumptions. Note that functional form extrapolations for planet occurrence rates as a function of orbital period may also differ.
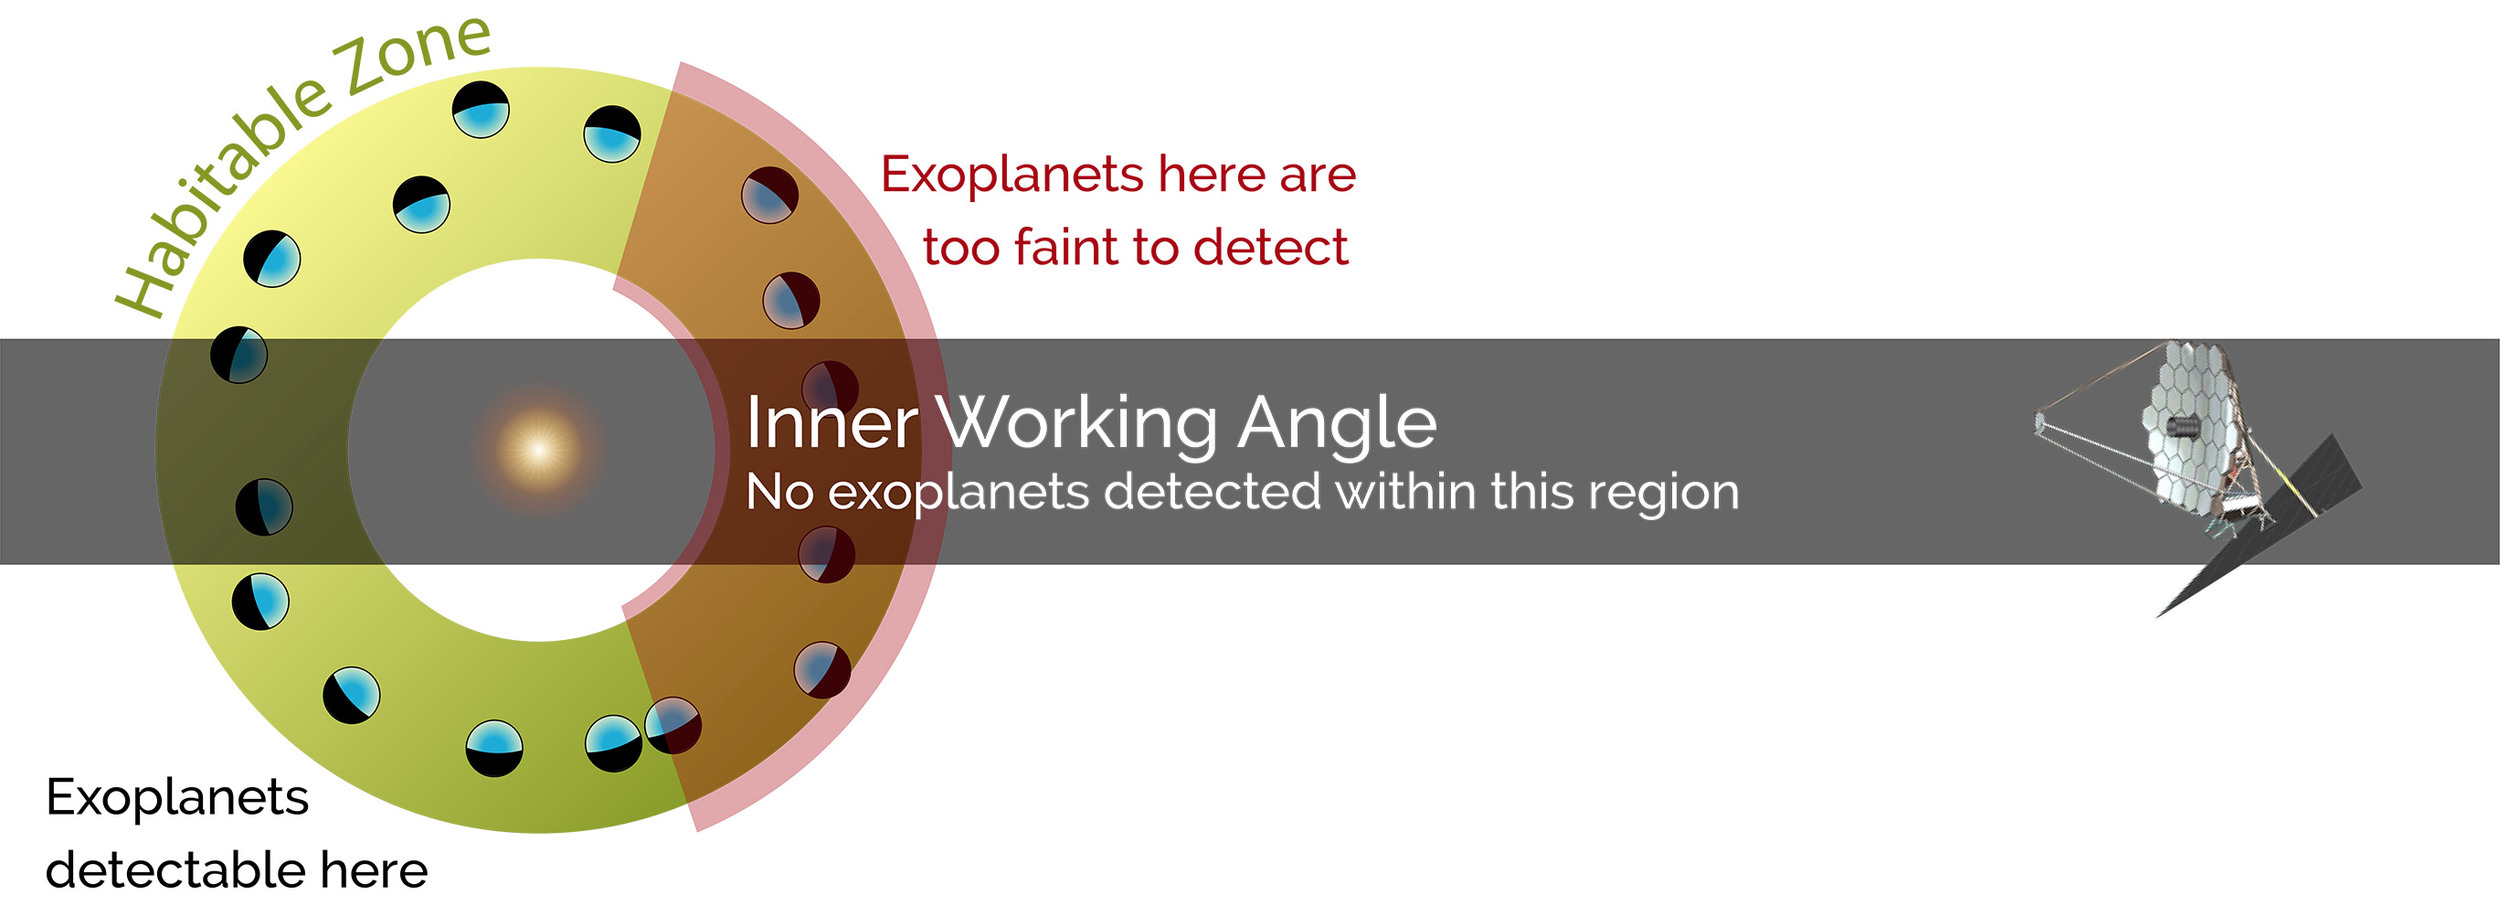
Figure 3-12
Illustration of the origins of obscurational and photometric incompleteness in direct imaging surveys. Image credit: C. Stark.
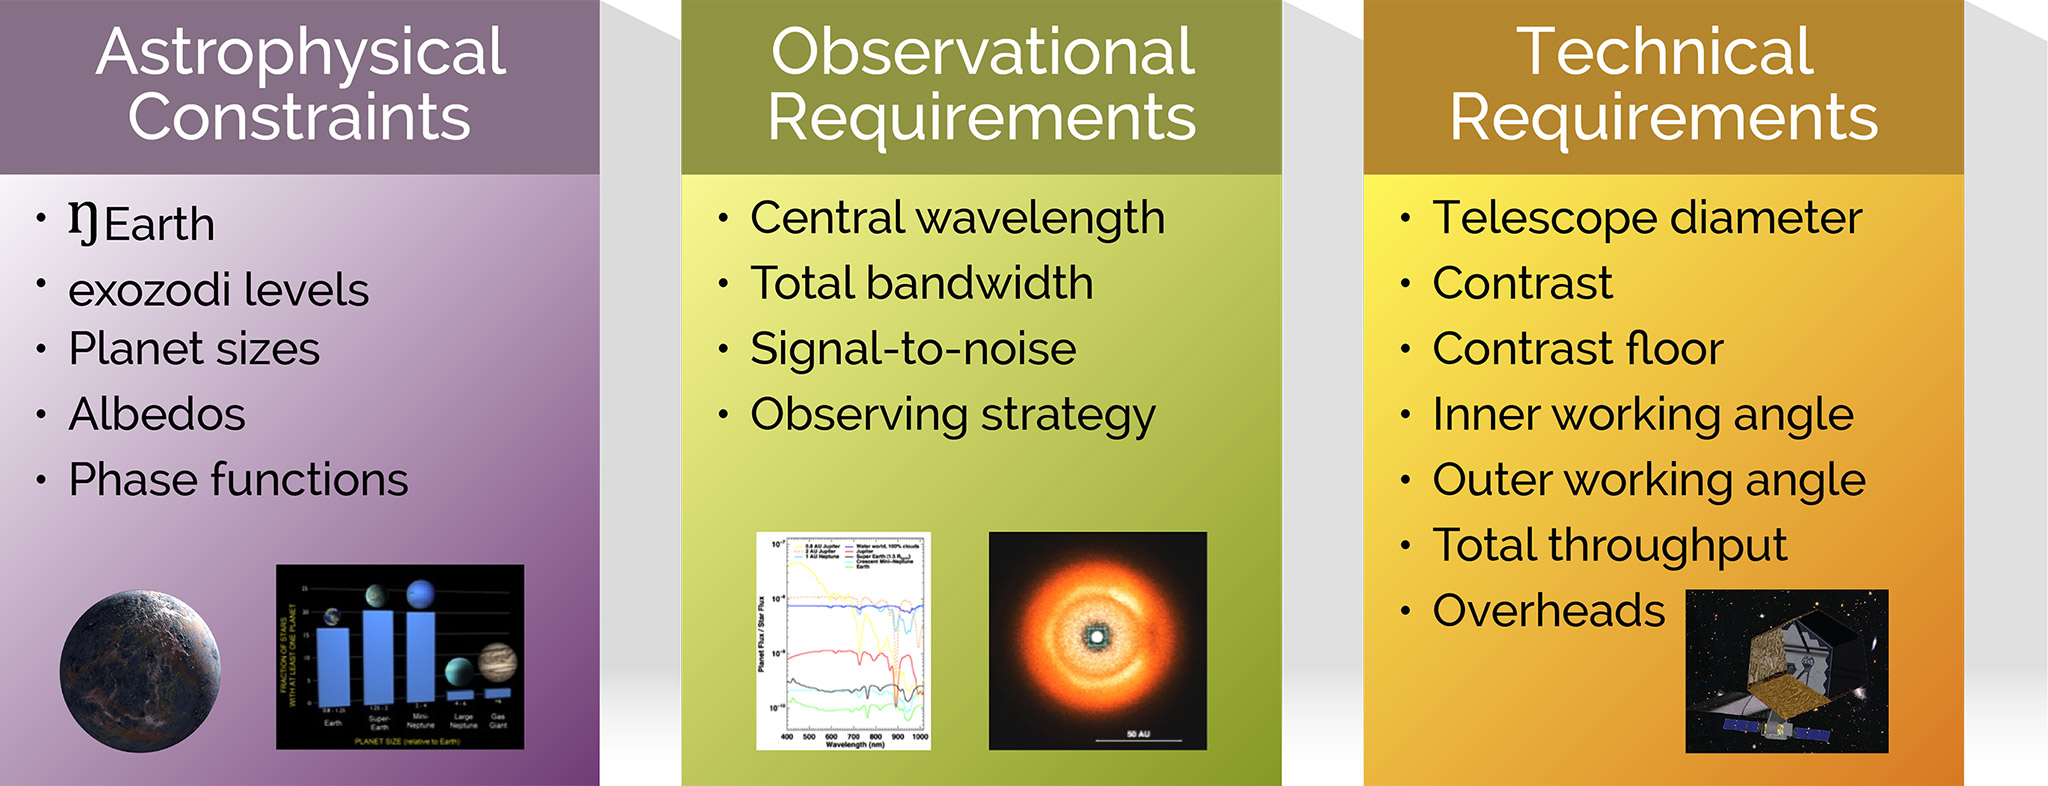
Figure 3-13
Schematic description of the input ingredients to the exoEarth yield calculations. Image credit: C. Stark.

Figure 3-14
Star positions and properties for an exoplanet survey considering visible wavelengths and an internal coronagraph. Telescope and coronagraph values are consistent with those described in the text for the exoEarth yield simulations. Plotted are: stars surveyed to optimize exoEarth yield for a 4 m aperture (74 stars, top); 8 m aperture (291 stars, middle); and 12 m aperture (582 stars, bottom) telescope given 1 total year of integration time (with 100% overheads) and including spectral characterization. Stars are plotted on a projection of a sphere with radius 35 parsecs. Star colors correspond to their B-V color and star size corresponds to the stellar luminosity with respect to Solar.

Figure 3-15
The number of candidate exoEarths that can be detected in the habitable zones of Sun-like stars as a function of telescope aperture diameter, assuming one year of on-sky observations, and including time to acquire R=70 spectra centered at 550 nm. Results are shown for two IWA values and for two values of ηEarth. Black curves are for an assumed exozodi background of 3 zodi. Gray curves show the impact of increasing exozodi levels to 5, 10, 50, and 100 zodi. If the same one year of observing time is spent only on discovery and not spectra, the yields may increase by as much as 40%. Image credit: C. Stark.
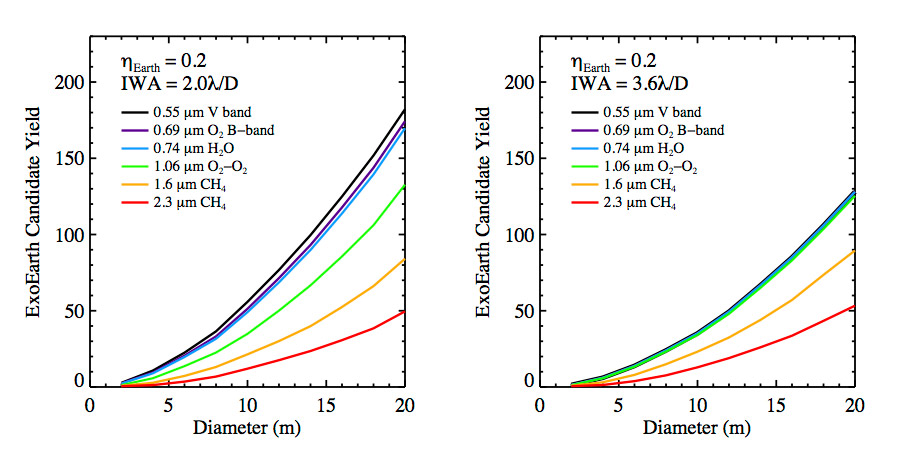
Figure 3-16
The number of planets discovered at 500 nm (black curve) that could also be detected at longer wavelengths (colored curves), as desired for spectroscopic observations, as a function of telescope aperture size and for two different assumed inner working angles. In other words, these plots show the number of planets that are visible at some point during their orbit, for a range of different wavelengths. Figure courtesy of C. Stark.

Figure 3-17
Simulation of a Solar System twin at a distance of 13.5 pc as seen with HDST (12 m space telescope) and a binary apodized-pupil coronagraph, optimized using the methods described in N’Diaye et al. (2015). The image here simulates a 40-hour exposure in 3 filters with 10% bandwidths centered at 400, 500, and 600 nm. The inner and outer working angles used in this simulation are 4 λ/D and 30 λ/D, respectively. The coronagraph design can support smaller inner working angles and larger outer working angles. Perfect PSF subtraction has been assumed (i.e., no wavefront drifts between target star and calibrator star). The Earth and its blue color are easily detected. The color of Venus is biased because that planet lies inside the inner working angle in the reddest exposure. The image employs a linear stretch to the outer working angle and a logarithmic stretch beyond that (where the purple-colored ring begins). Image credit: L. Pueyo, M. N’Diaye.
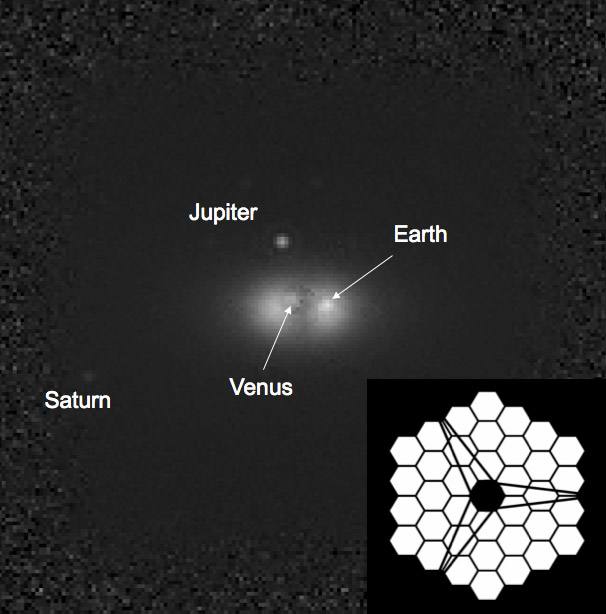
Figure 3-18
Simulated near-IR (1.6 μm, 20% band) image of a solar system twin at a distance of 13.5 pc as seen by HDST (12 m space telescope) with a 2 day exposure. The pupil geometry adopted for this simulation is shown in the lower right. A Phase- Induced Amplitude Apodization Complex Mask Coronagraph (PIAACMC), offering small IWA (1.25 λ/D), is used here to overcome the larger angular resolution at longer wavelength. Earth, at 2.65 λ/D separation, is largely unattenuated, while Venus, at 1.22 λ/D, is partially attenuated by the coronagraph mask. At this wavelength, the wavefront control system (assumed here to use 64 x 64 actuator deformable mirrors) offers a larger high contrast field of view, allowing Saturn to be imaged in reflected light. This simulation assumes PSF subtraction to photon noise sensitivity. In the stellar image prior to PSF subtraction, the largest light contribution near the coronagraph IWA is due to finite stellar angular size (0.77 mas diameter stellar disk).

Figure 3-19
Simulated false-color (450–850 nm) image of a planetary system around a nearby G star (Beta Cvn) seen by a 12 m optical space telescope equipped with a free-flying ~100 m diameter starshade. Imperfections in the starshade scatter some starlight and sunlight into the center of the image, yielding a contrast of 4 × 10-11 at 1 AU, but twins of Venus, Earth, Jupiter and Saturn stand out clearly from the PSF wings on either side of the starshade. A Mars twin may also be detectable in one-day exposures like this one with some careful calibration. The large aperture easily separates planets from background galaxies and local and external zodiacal dust (all included), but still senses the narrow dust ring at 3.5 AU in this model, 10× fainter than any other current or upcoming missions can reach. Credit: M. Kuchner.