Gallery: Chapter 4
Gallery: Chapter 4
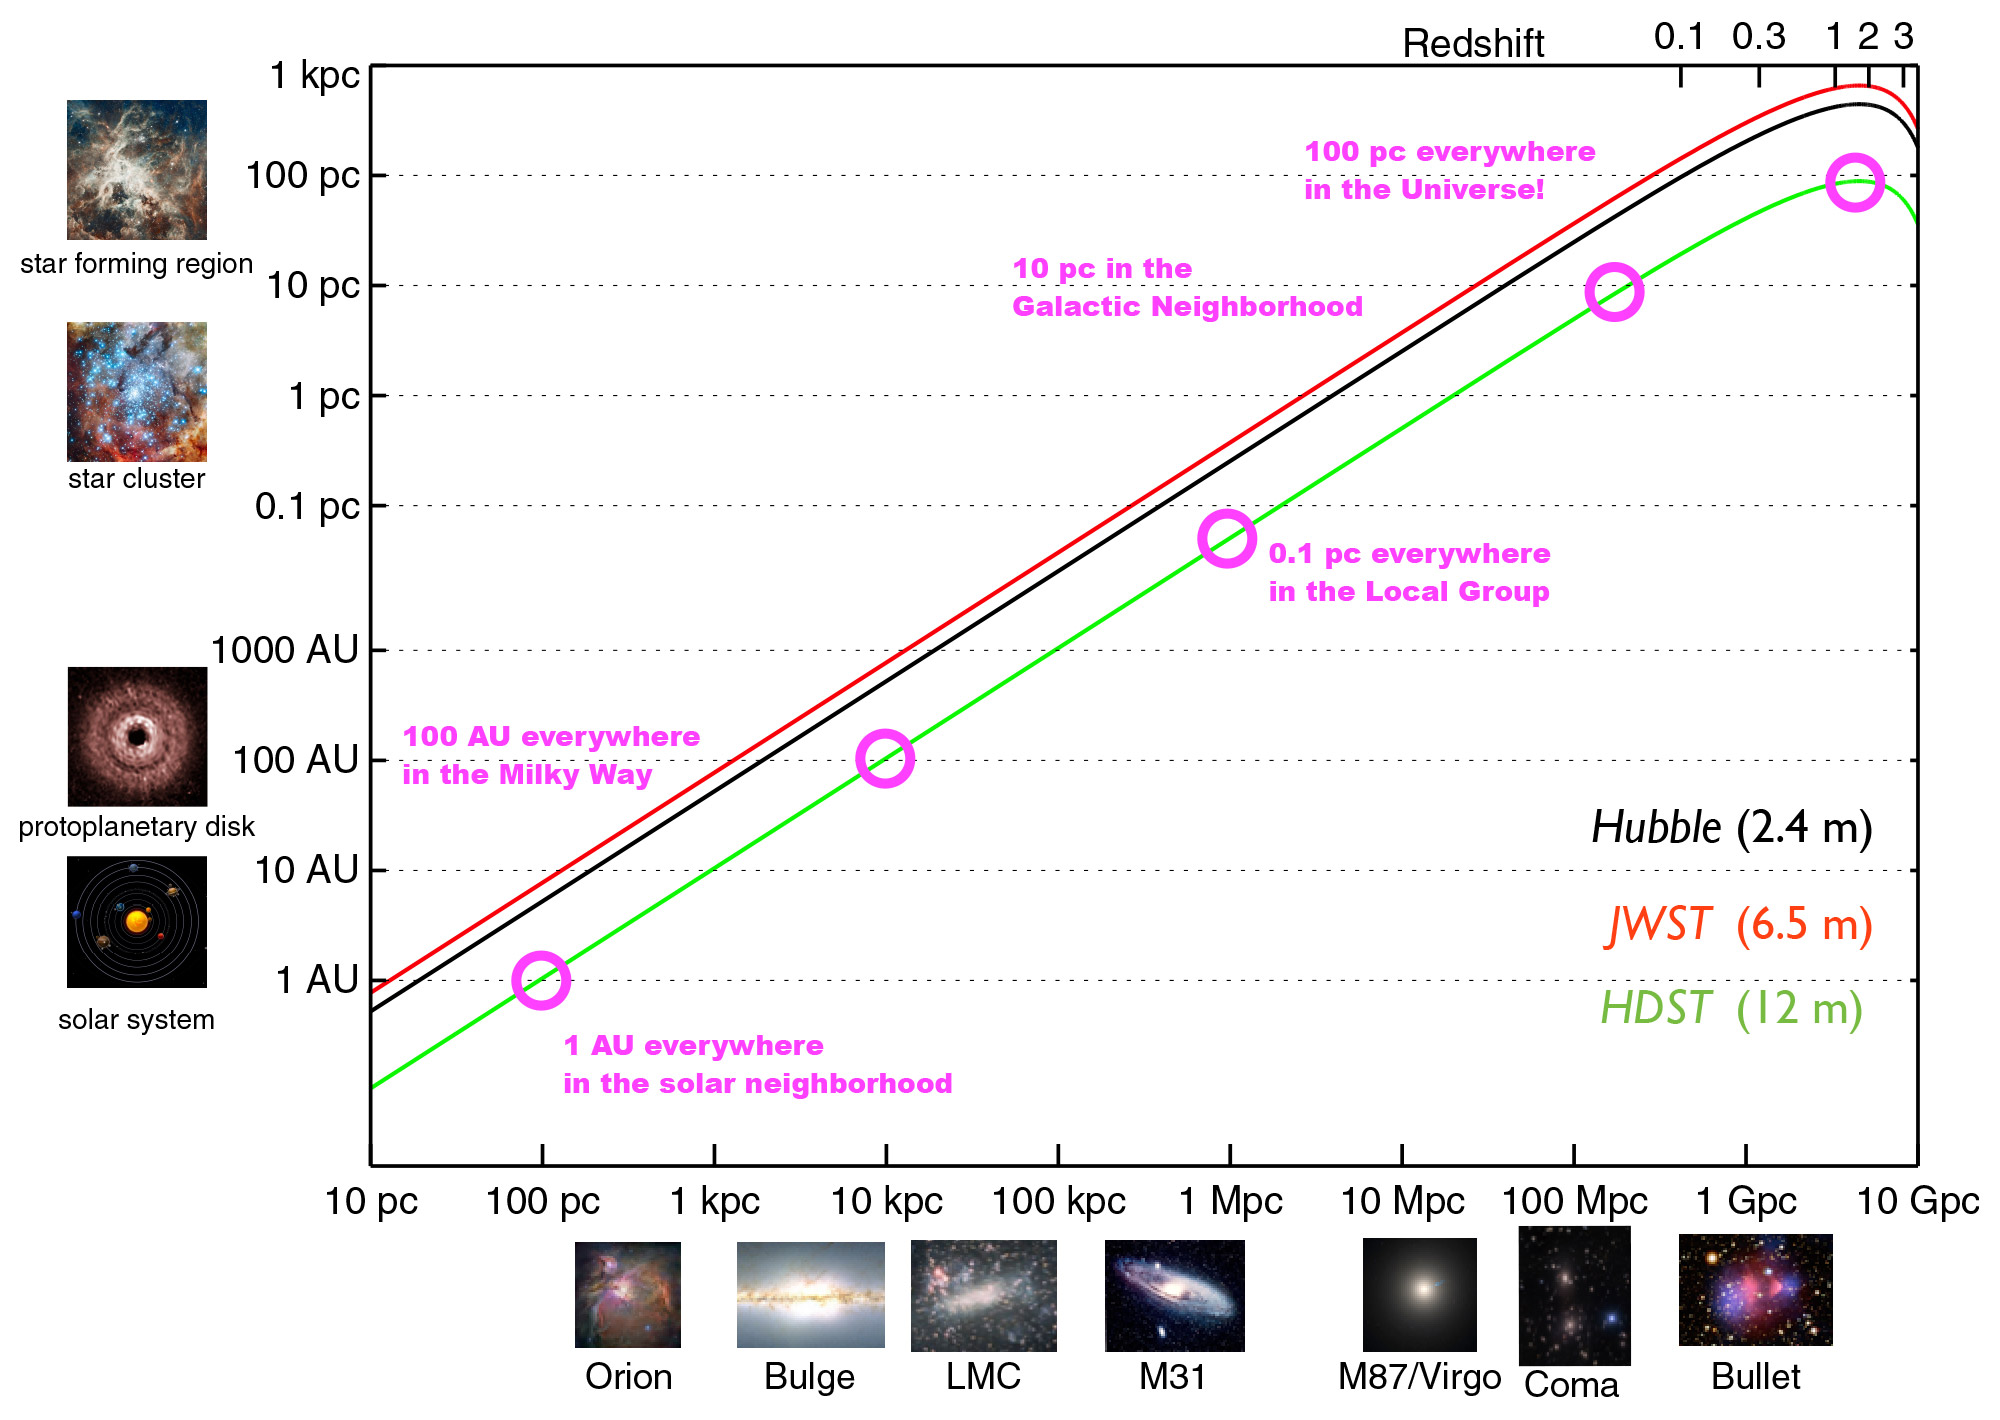
Figure 4-1
Telescopes imaging at their diffraction limit offer high-definition views of the Universe across cosmic distances. Major resolution thresholds reached by HDST are marked in magenta and illustrated at left. For a 12 m aperture, the resolution element at HDST’s 0.5-micron diffraction limit corresponds to 100 parsecs or less at all cosmological distances in the observable Universe. The D = 2.4 m Hubble (black line) is diffraction limited at λ = 0.6 micron, and the 6.5 m JWST (red line) is diffraction limited at λ = 2 microns, such that their physical resolution elements (proportional to λ/D) are about the same.
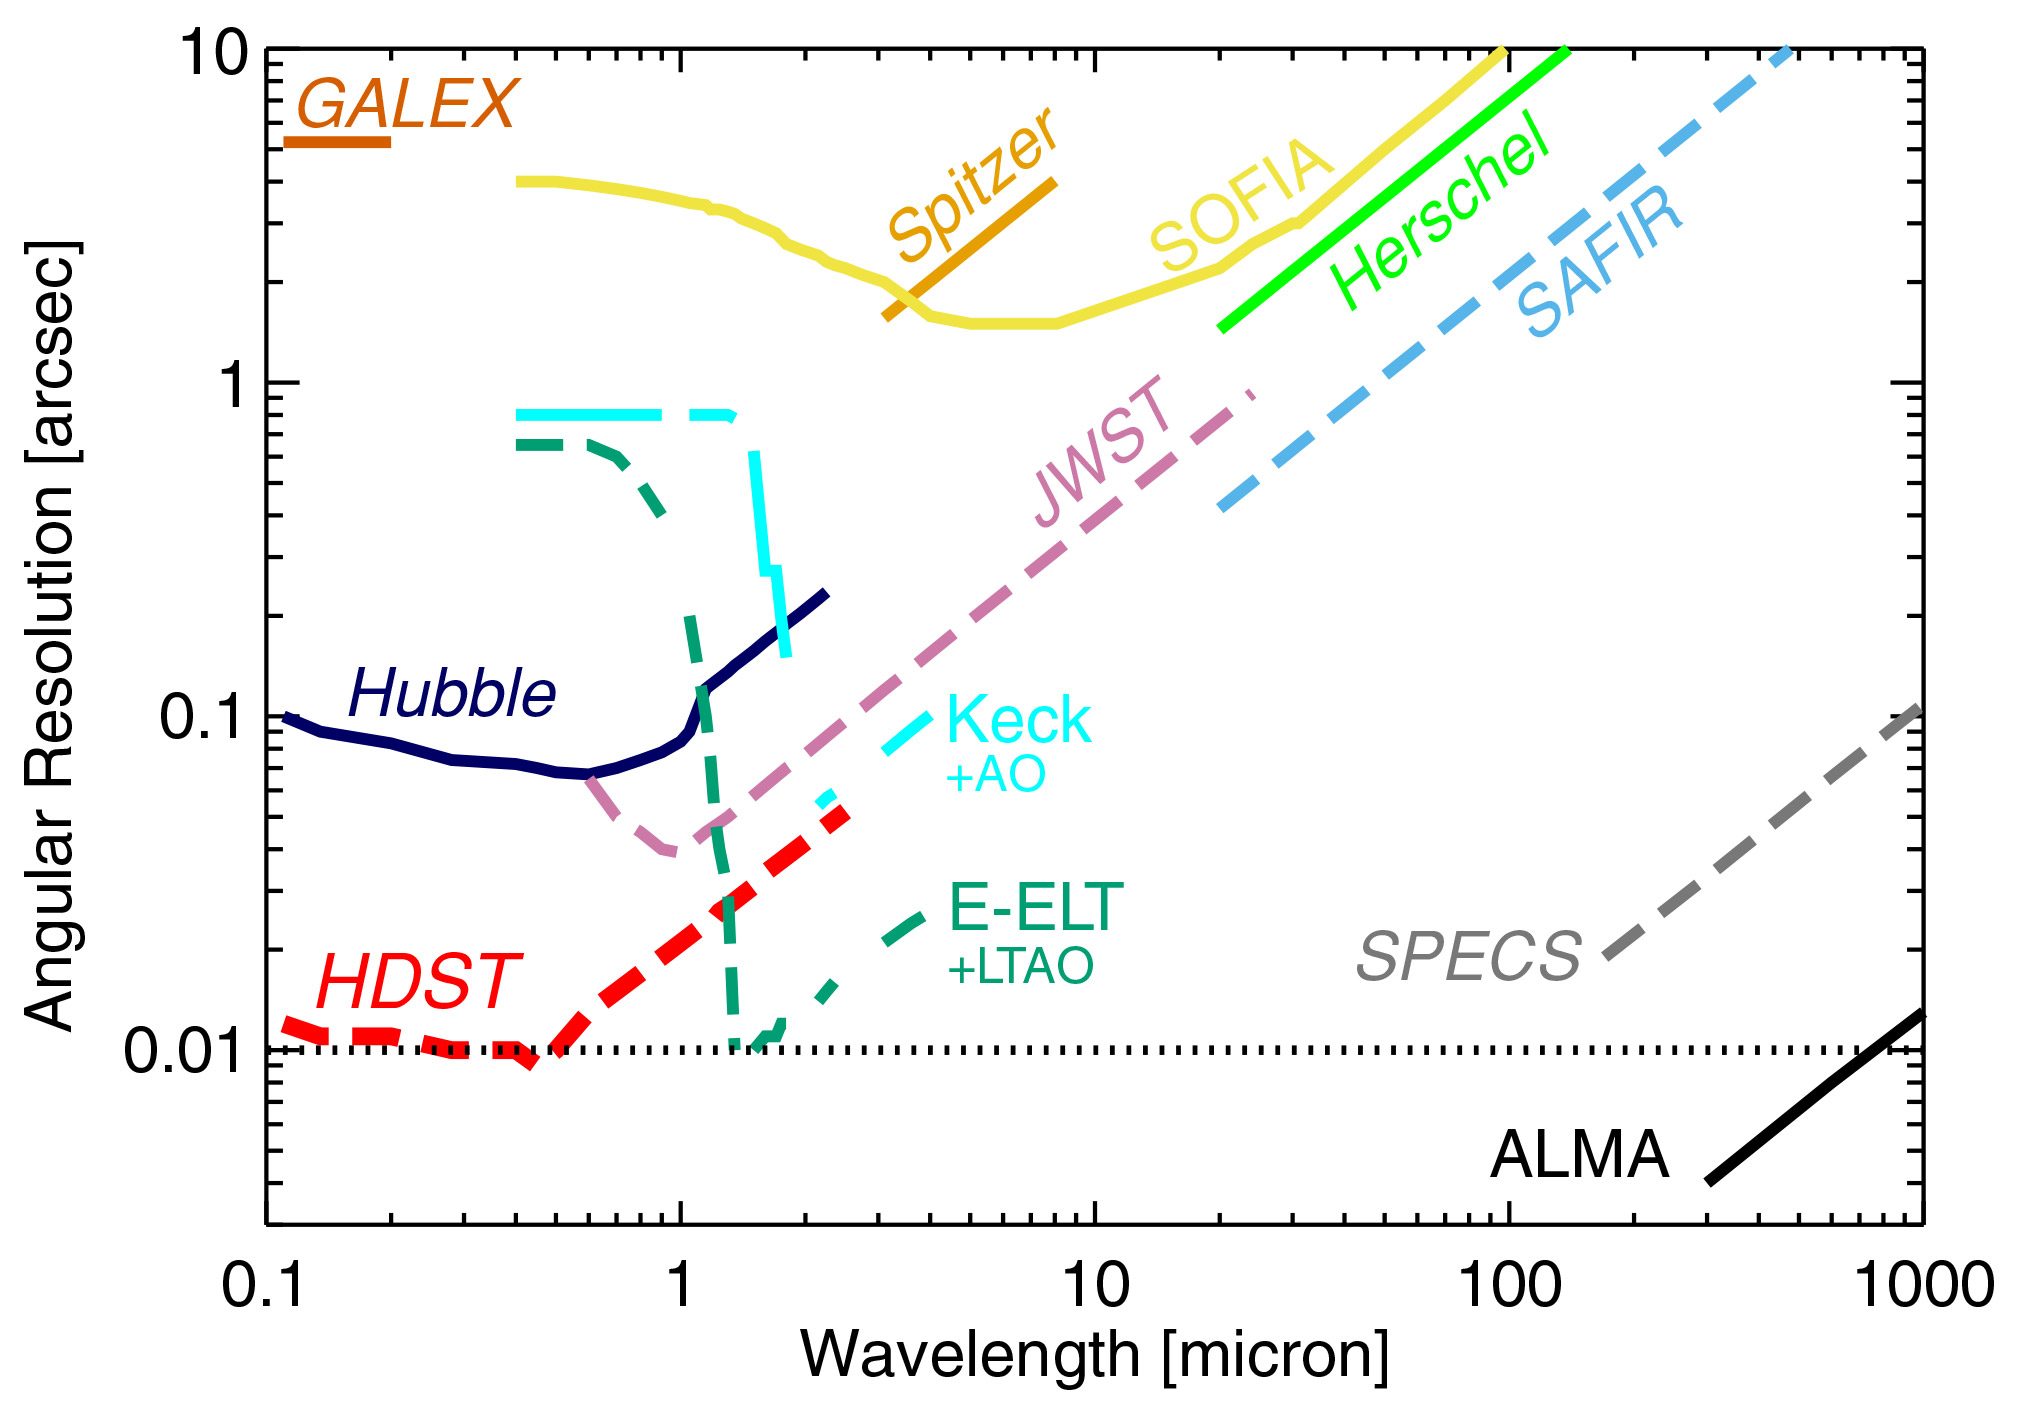
Figure 4-2
Angular resolution as a function of wavelength for current, planned, and possible future astronomical facilities. The HDST resolution is shown assuming a 12 m aperture, diffraction limited at 500 nm. The expected performances from facilities that are still in pre-construction or conceptual phases are shown as dashed lines. Some ground-based facilities have non-continuous wavelength coverage due to atmospheric absorption features.
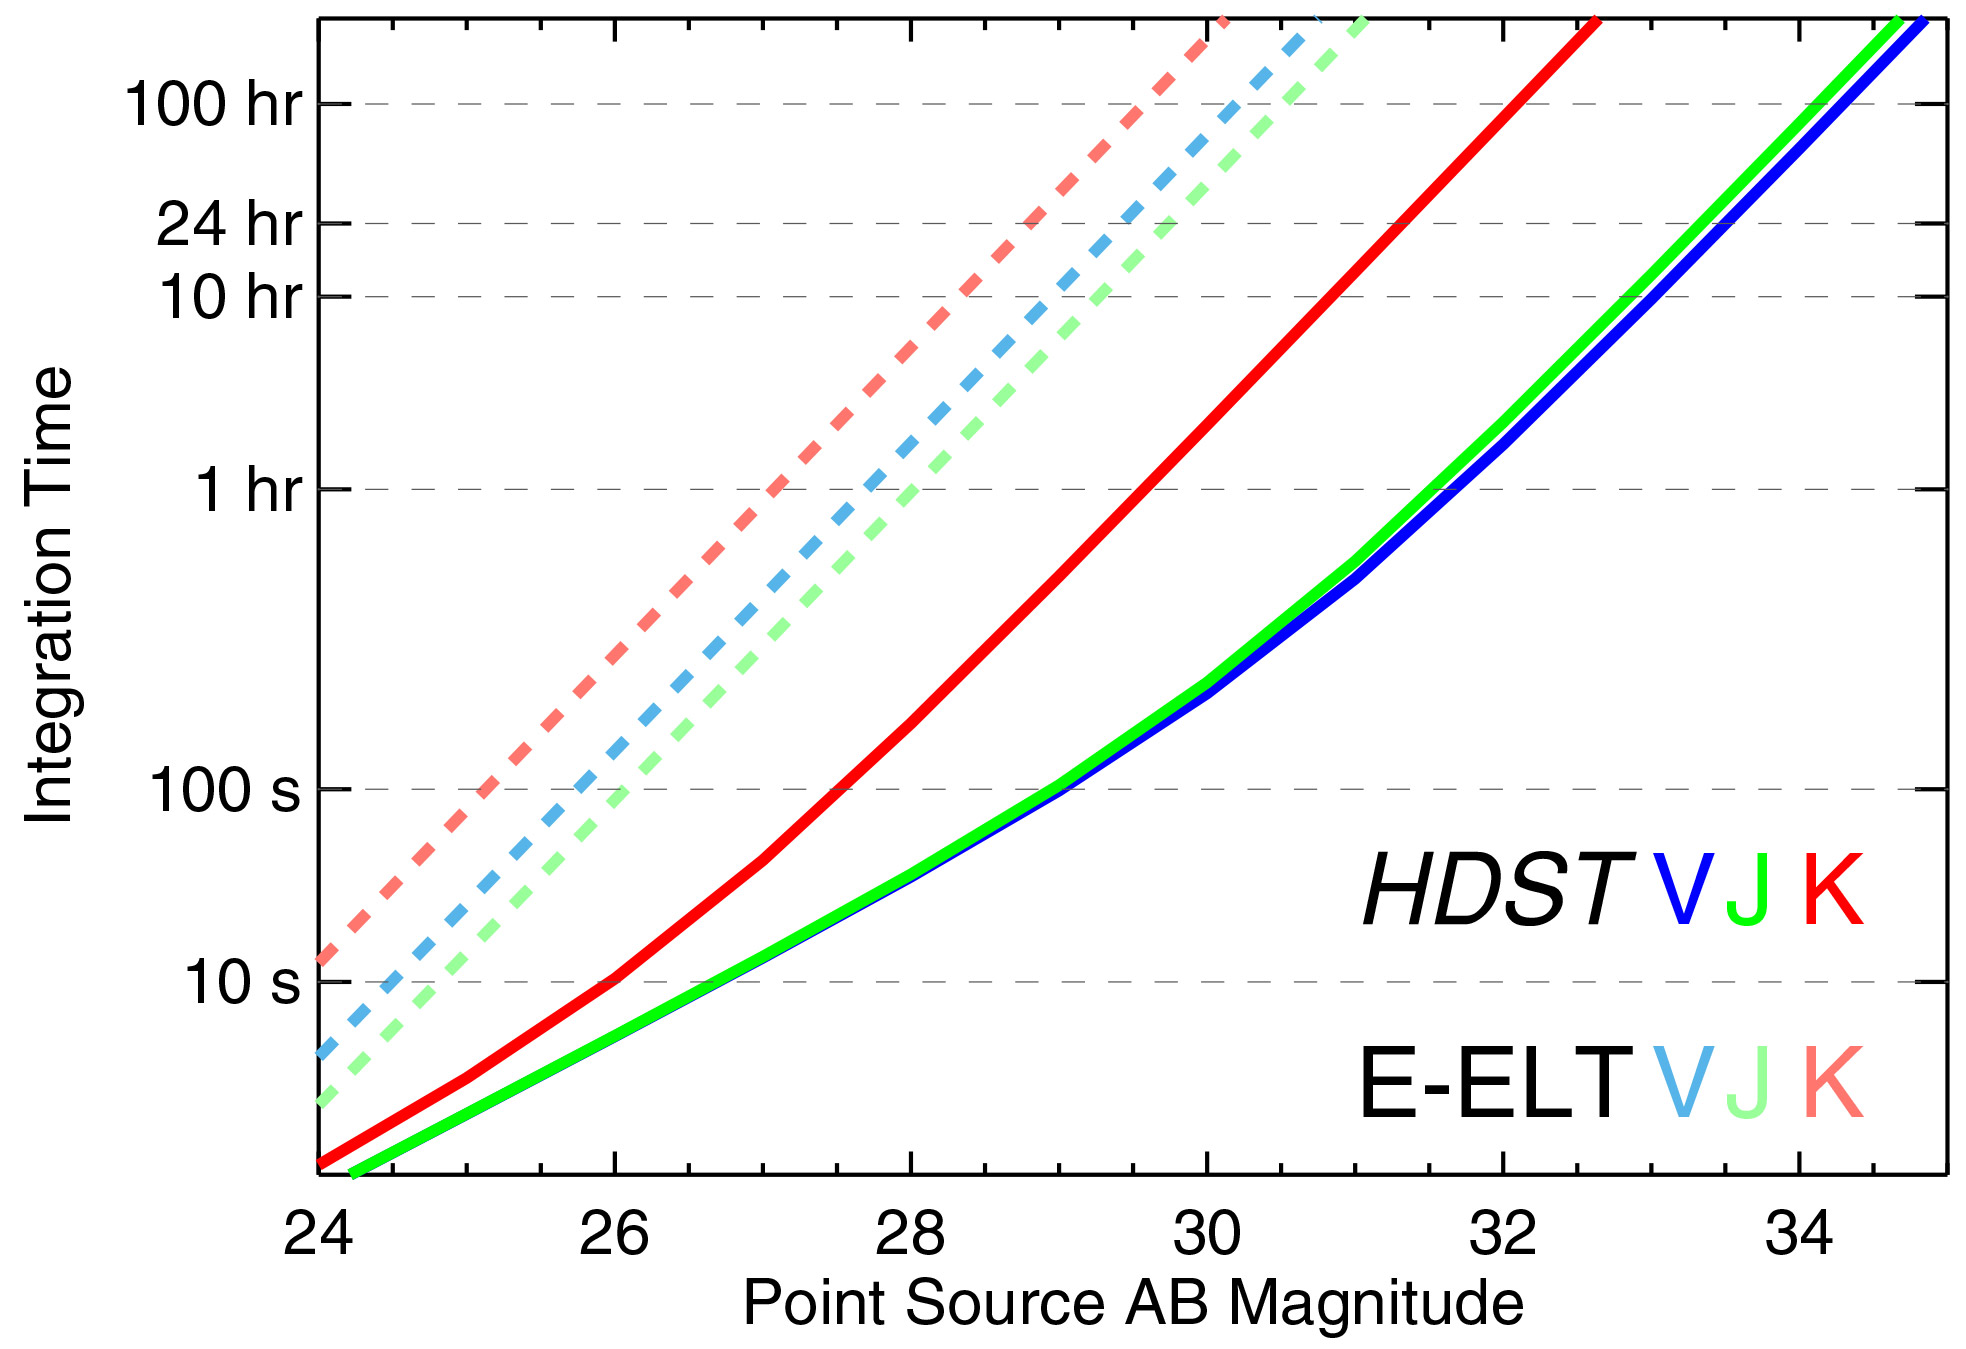
Figure 4-3
The total integration time needed to reach a 10-sigma point-source limiting magnitude for the 38 m E-ELT and a 12 m HDST (assumed here to operate at 270 K). Computations are done for 3 different passbands: V, J, and K. Total system throughput and instrument characteristics (read noise, dark current) are adopted from the ESO E-ELT ETC website. The E-ELT is assumed to perform at its diffraction limit at wavelengths longer than 1 micron and seeing-limited (0.6 arcsec) for wavelengths below 1 micron.
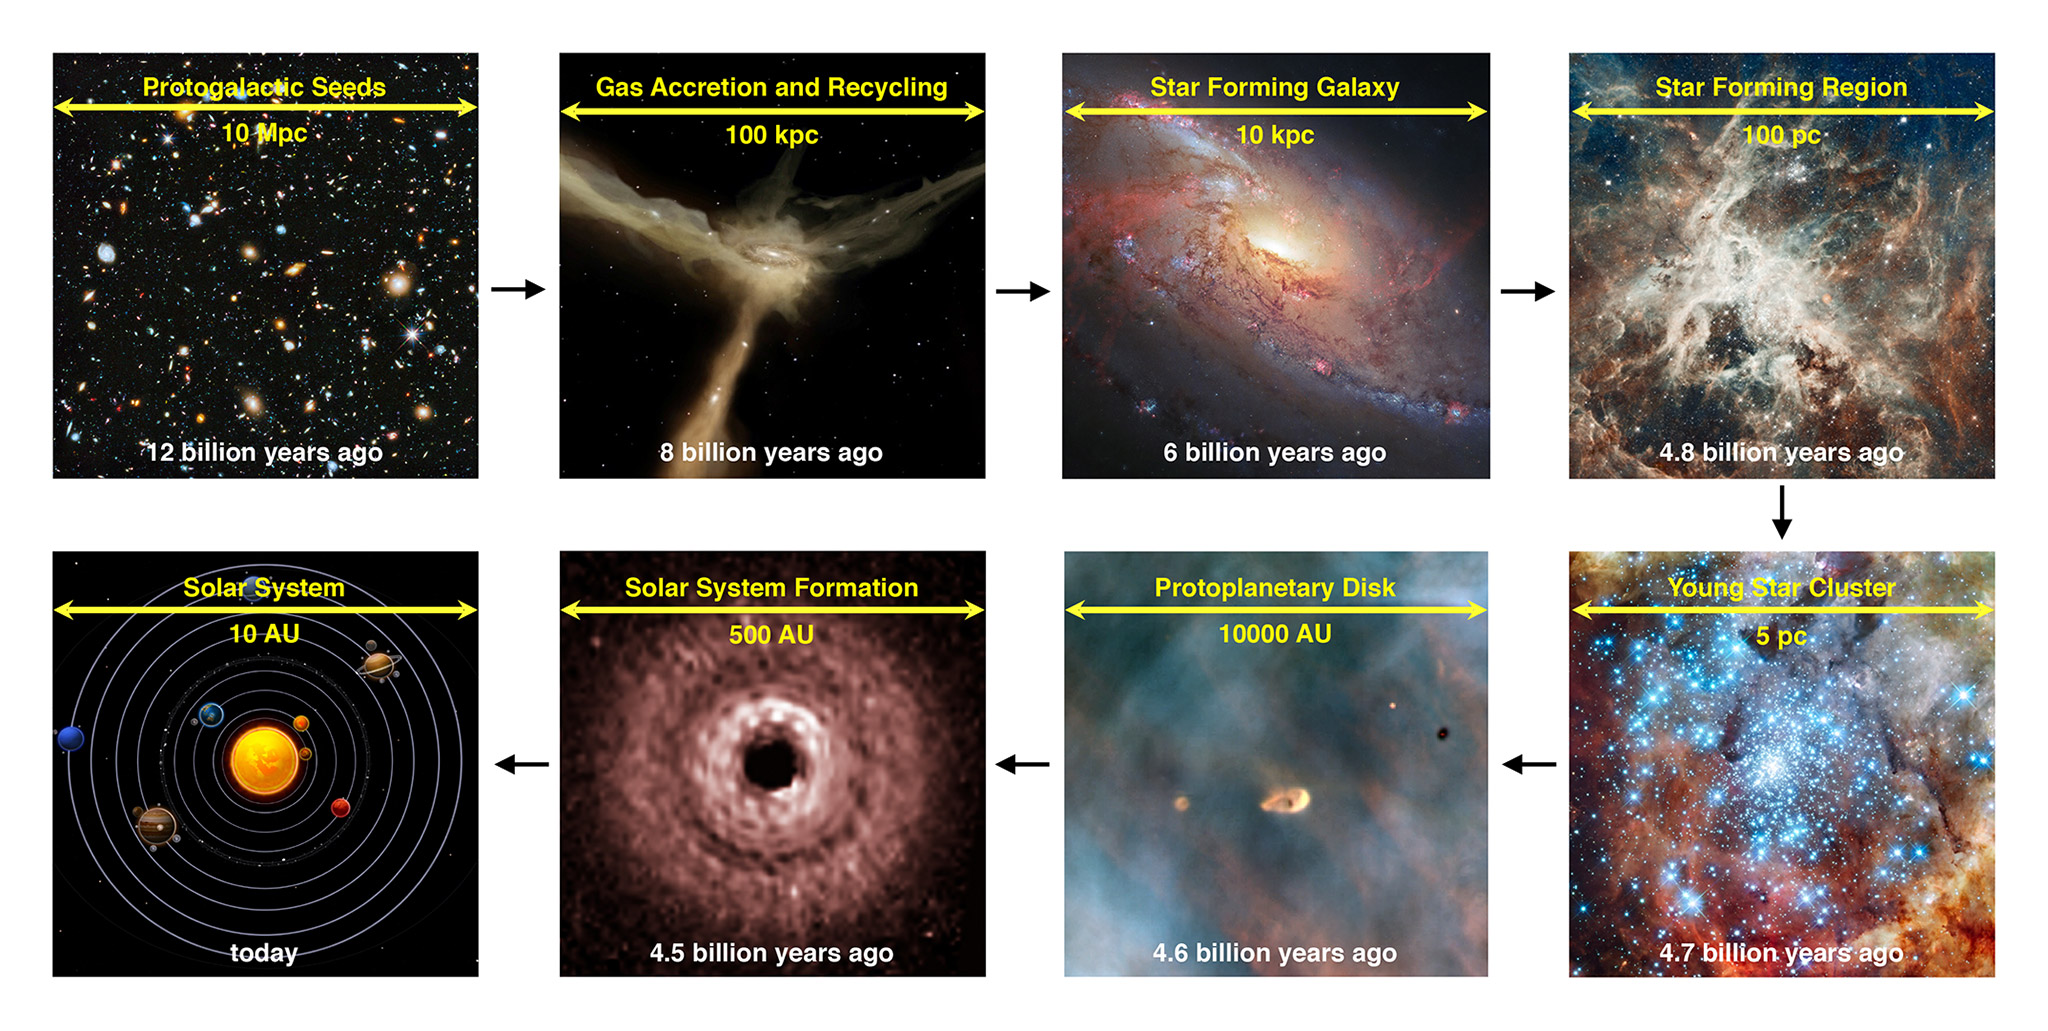
Figure 4-4
The path from Cosmic Birth to Living Earth, witnessed at a range of physical scales. Stars in the first galaxies produce the first heavy elements, which leave those galaxies and recycle into the larger galaxies they become. Mature galactic disks form later, composed of many star-forming regions at 50–100 parsec in size. Inside these regions form multiple star clusters, each of which includes massive stars that forge more heavy elements and low-mass stars that host protoplanetary disks. At 4.5 billion years ago, one such disk in our Milky Way formed the Earth and its siblings in the Solar System.
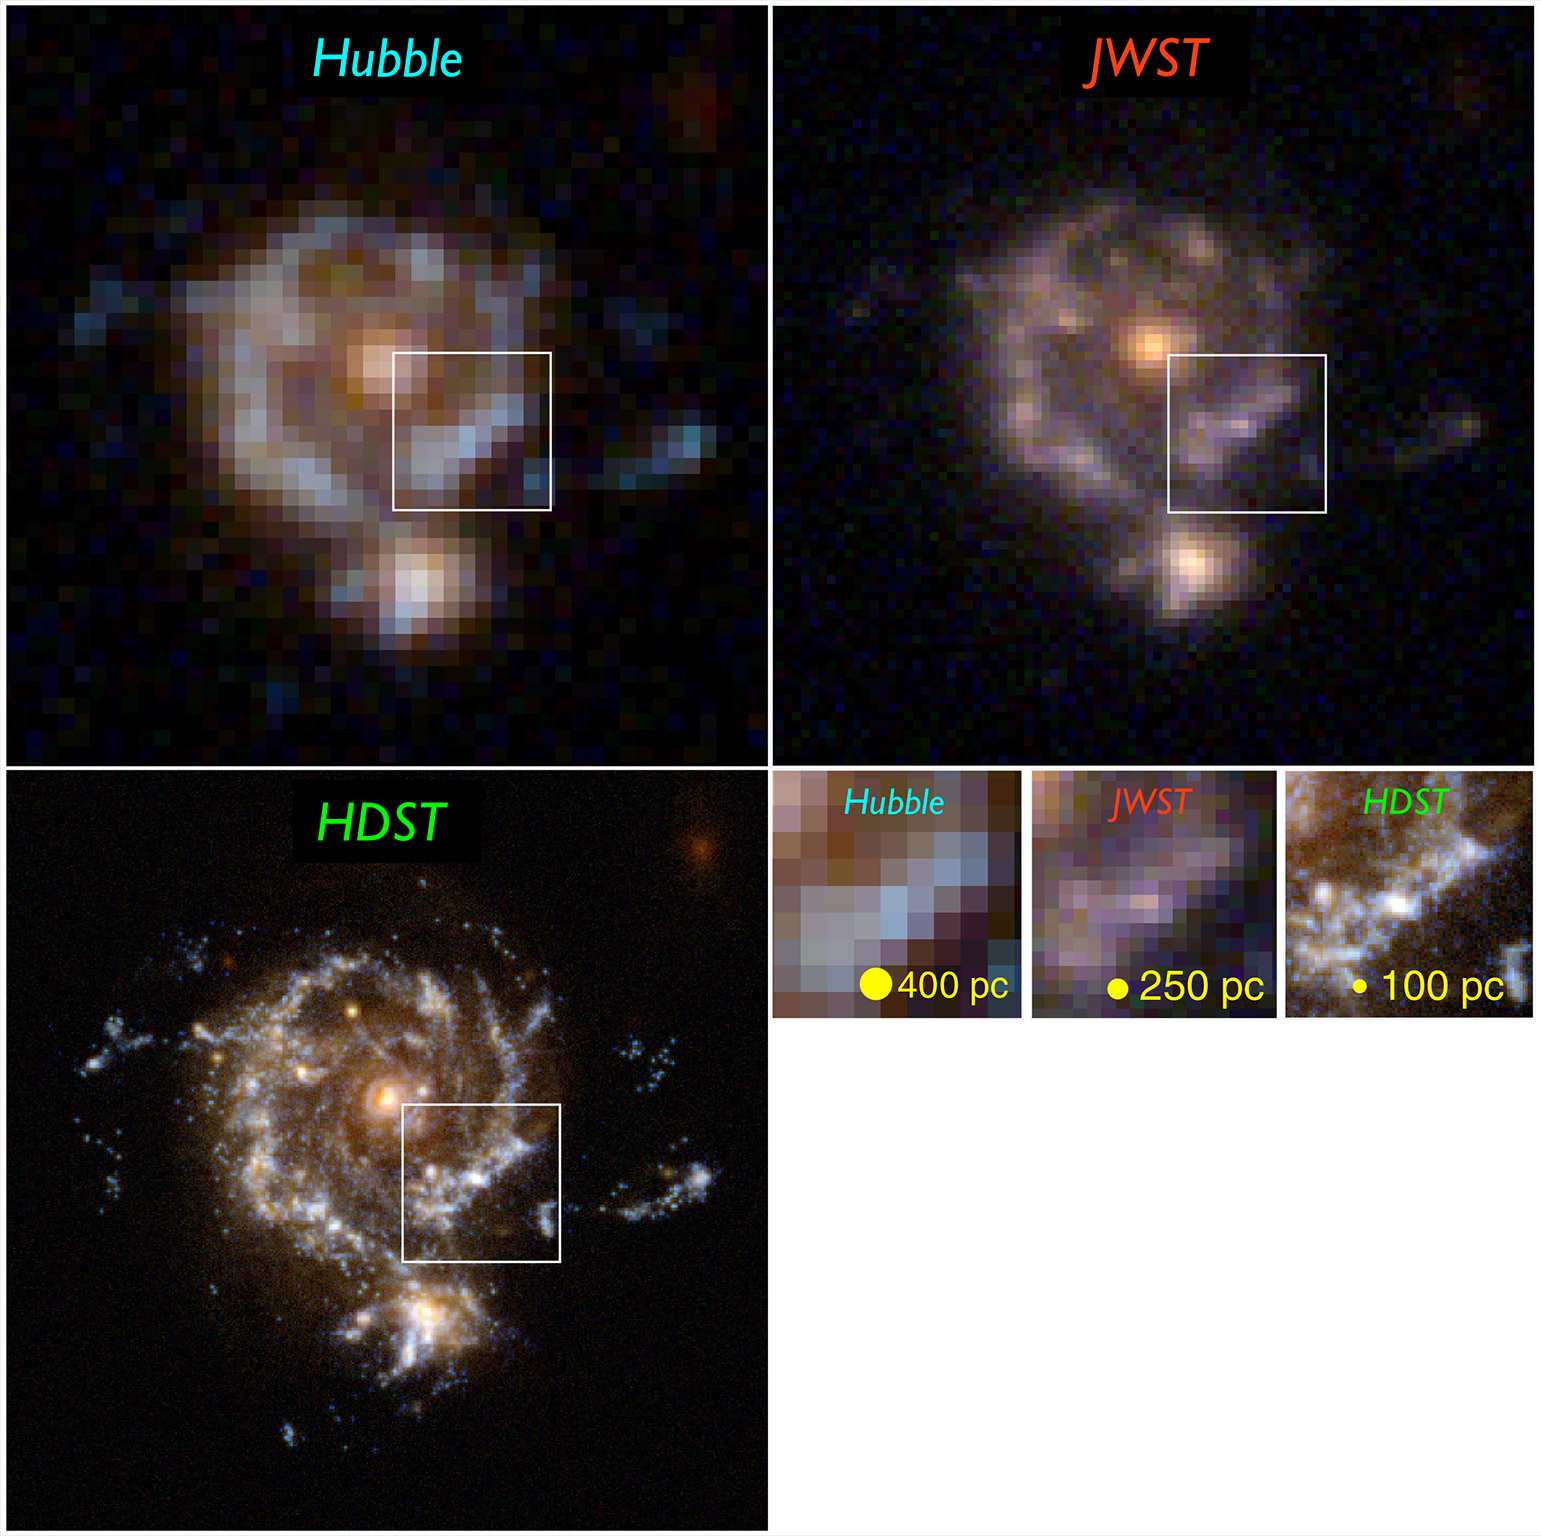
Figure 4-5
A simulated galaxy viewed by Hubble, JWST, and HDST at z = 2. The renderings show a one-hour observation (VIH for Hubble and HDST, zJH for JWST). Hubble and JWST detect the bulge and disk, but only the exquisite image quality of HDST resolves the galaxy’s star-forming regions and its dwarf satellite. The zoom shows the inner disk region, where only HDST can resolve the star-forming regions and separate them from the redder, more distributed old stellar population. Image credit: D. Ceverino, C. Moody, and G. Snyder.
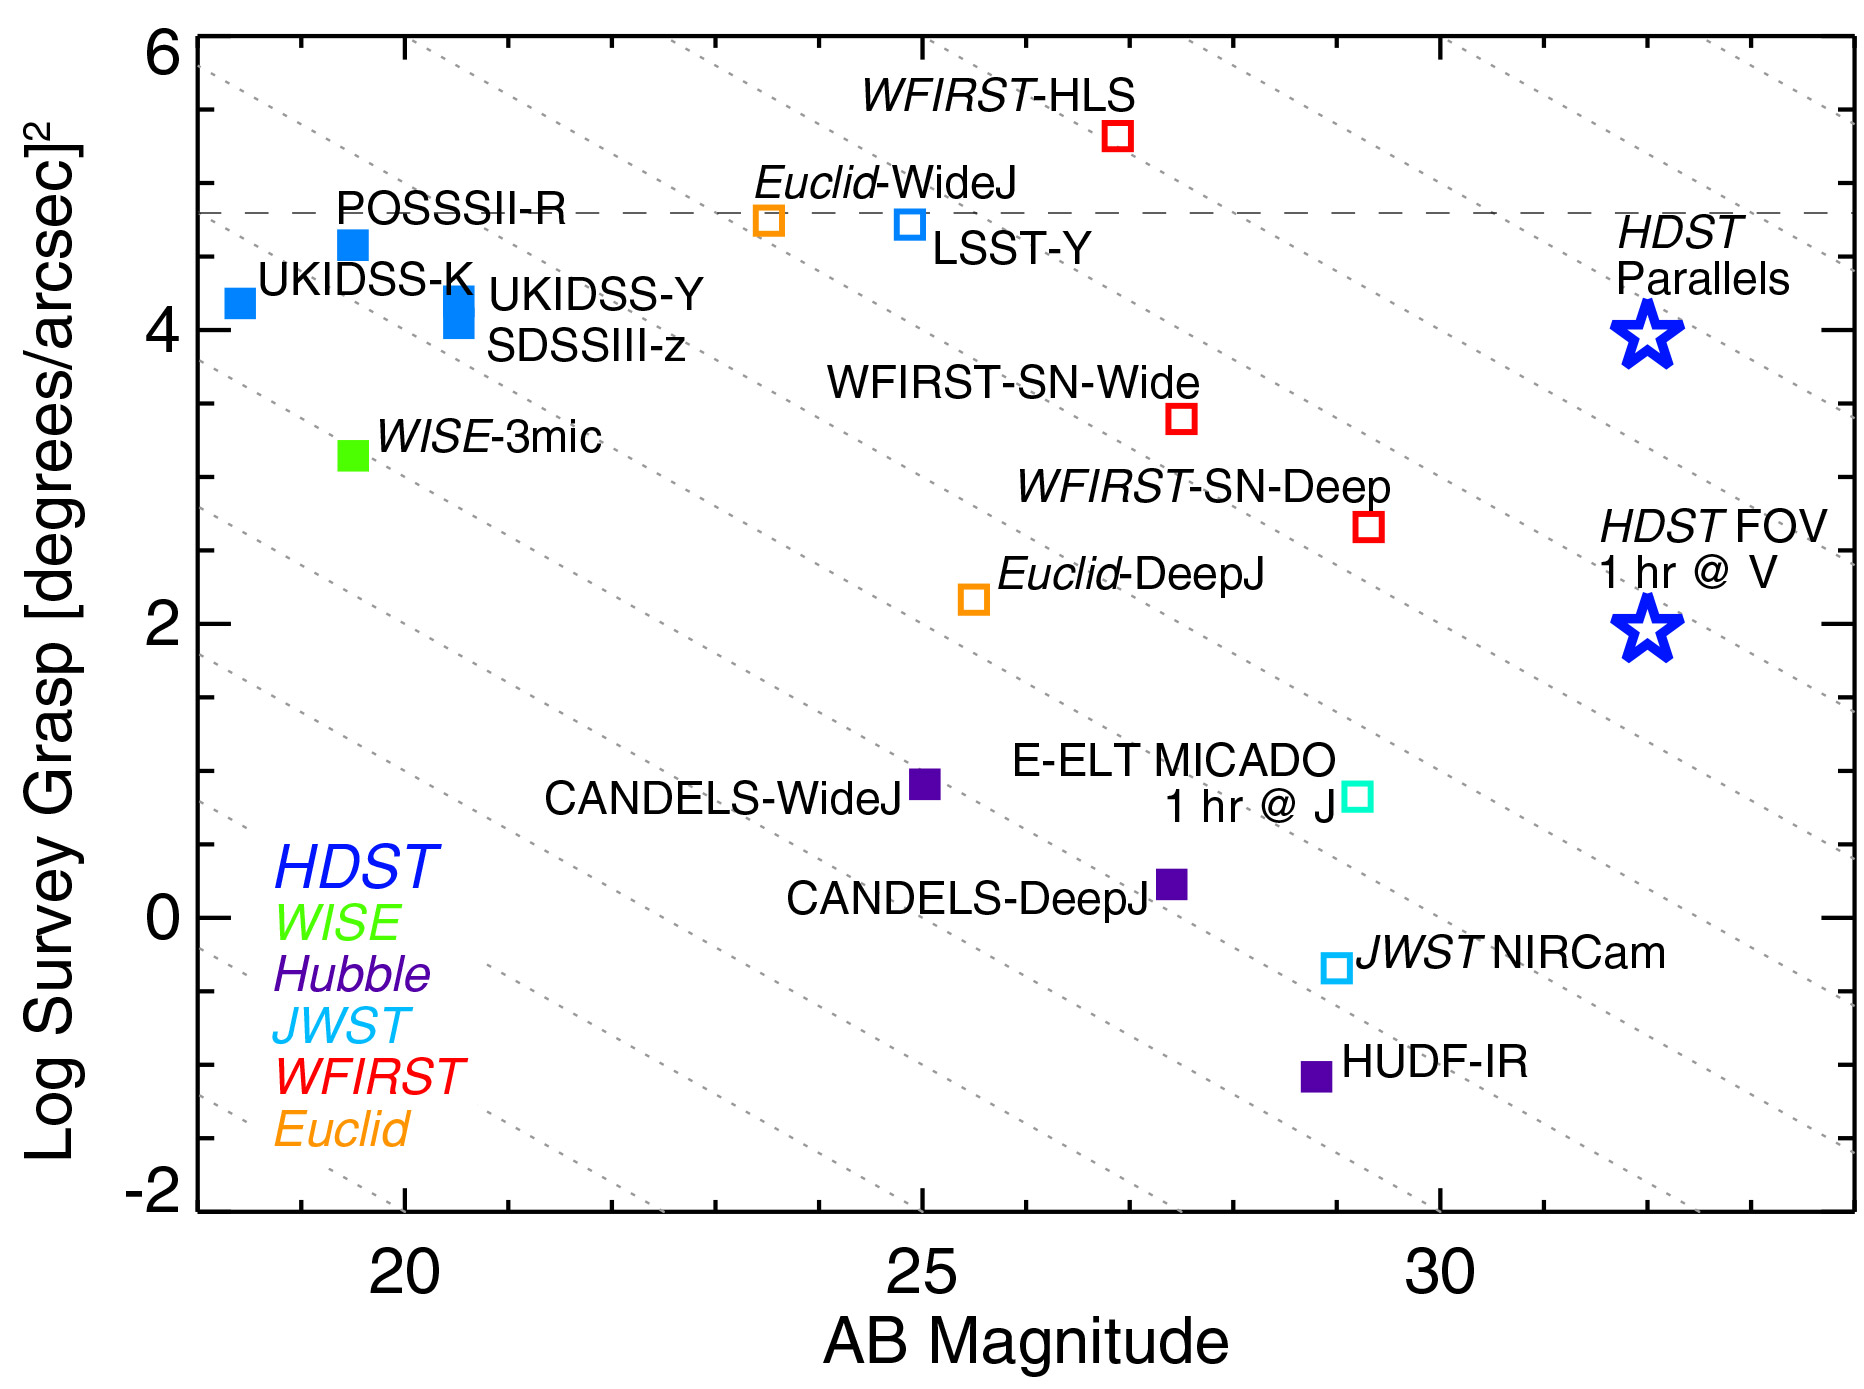
Figure 4-6
A comparison of present and future observatories and sky surveys in terms of “information content,” defined as the number of spatial resolution elements in the observed field. This figure of merit increases toward the upper right, perpendicular to the diagonal lines. Current facilities are marked with filled symbols and future facilities with open symbols. All-sky ground-based surveys cluster around the horizontal line, which marks the entire sky observed at 1ʺ resolution. Space-based narrow/deep fields cluster at lower right. Large ground-based telescopes achieve high resolution, but over relatively small fields of view (~1 arcmin), and are limited in depth by sky backgrounds. WFIRST/AFTA will expand Hubble-like imaging and depth to much larger areas, moving toward the upper right. Though it observes smaller fields, its exquisite spatial resolution means that HDST will surpass WFIRST/AFTA in information content on galaxies.
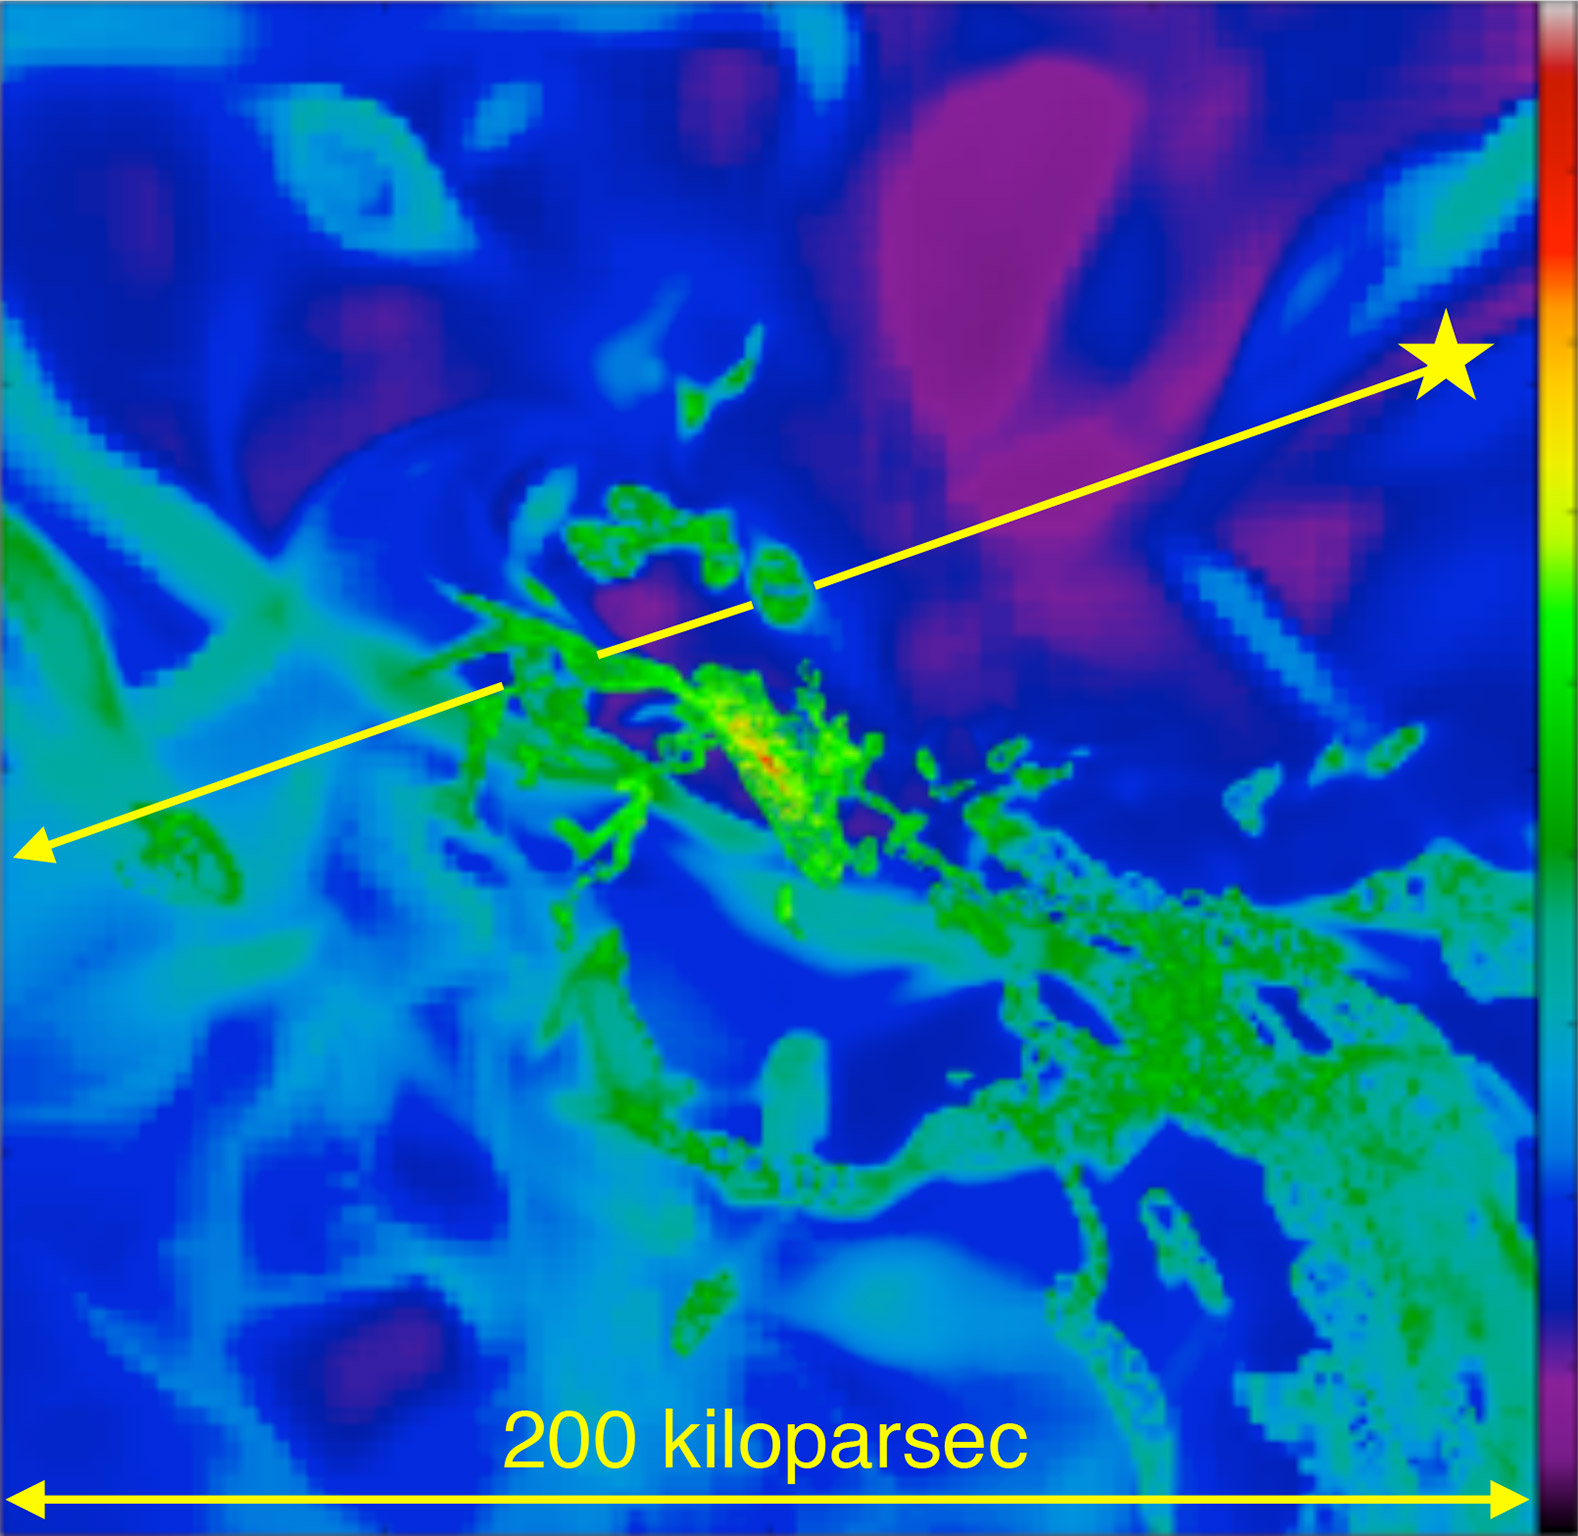
Figure 4-7
A visualization of the Circumgalactic Medium (CGM) gas fueling a Milky-Way-like galaxy. The color renders the strength of UV emission by triply ionized Carbon (C IV) in the CGM gas surrounding a Milky-Way-analog galaxy at z ~ 0.25. HDST should be able to directly detect gas emission from infalling filaments (green regions) and absorption from C IV and many other species in absorption at all densities. Image credit: Joung, Fernandez, Bryan, Putman & Corlies (2012, 2015).
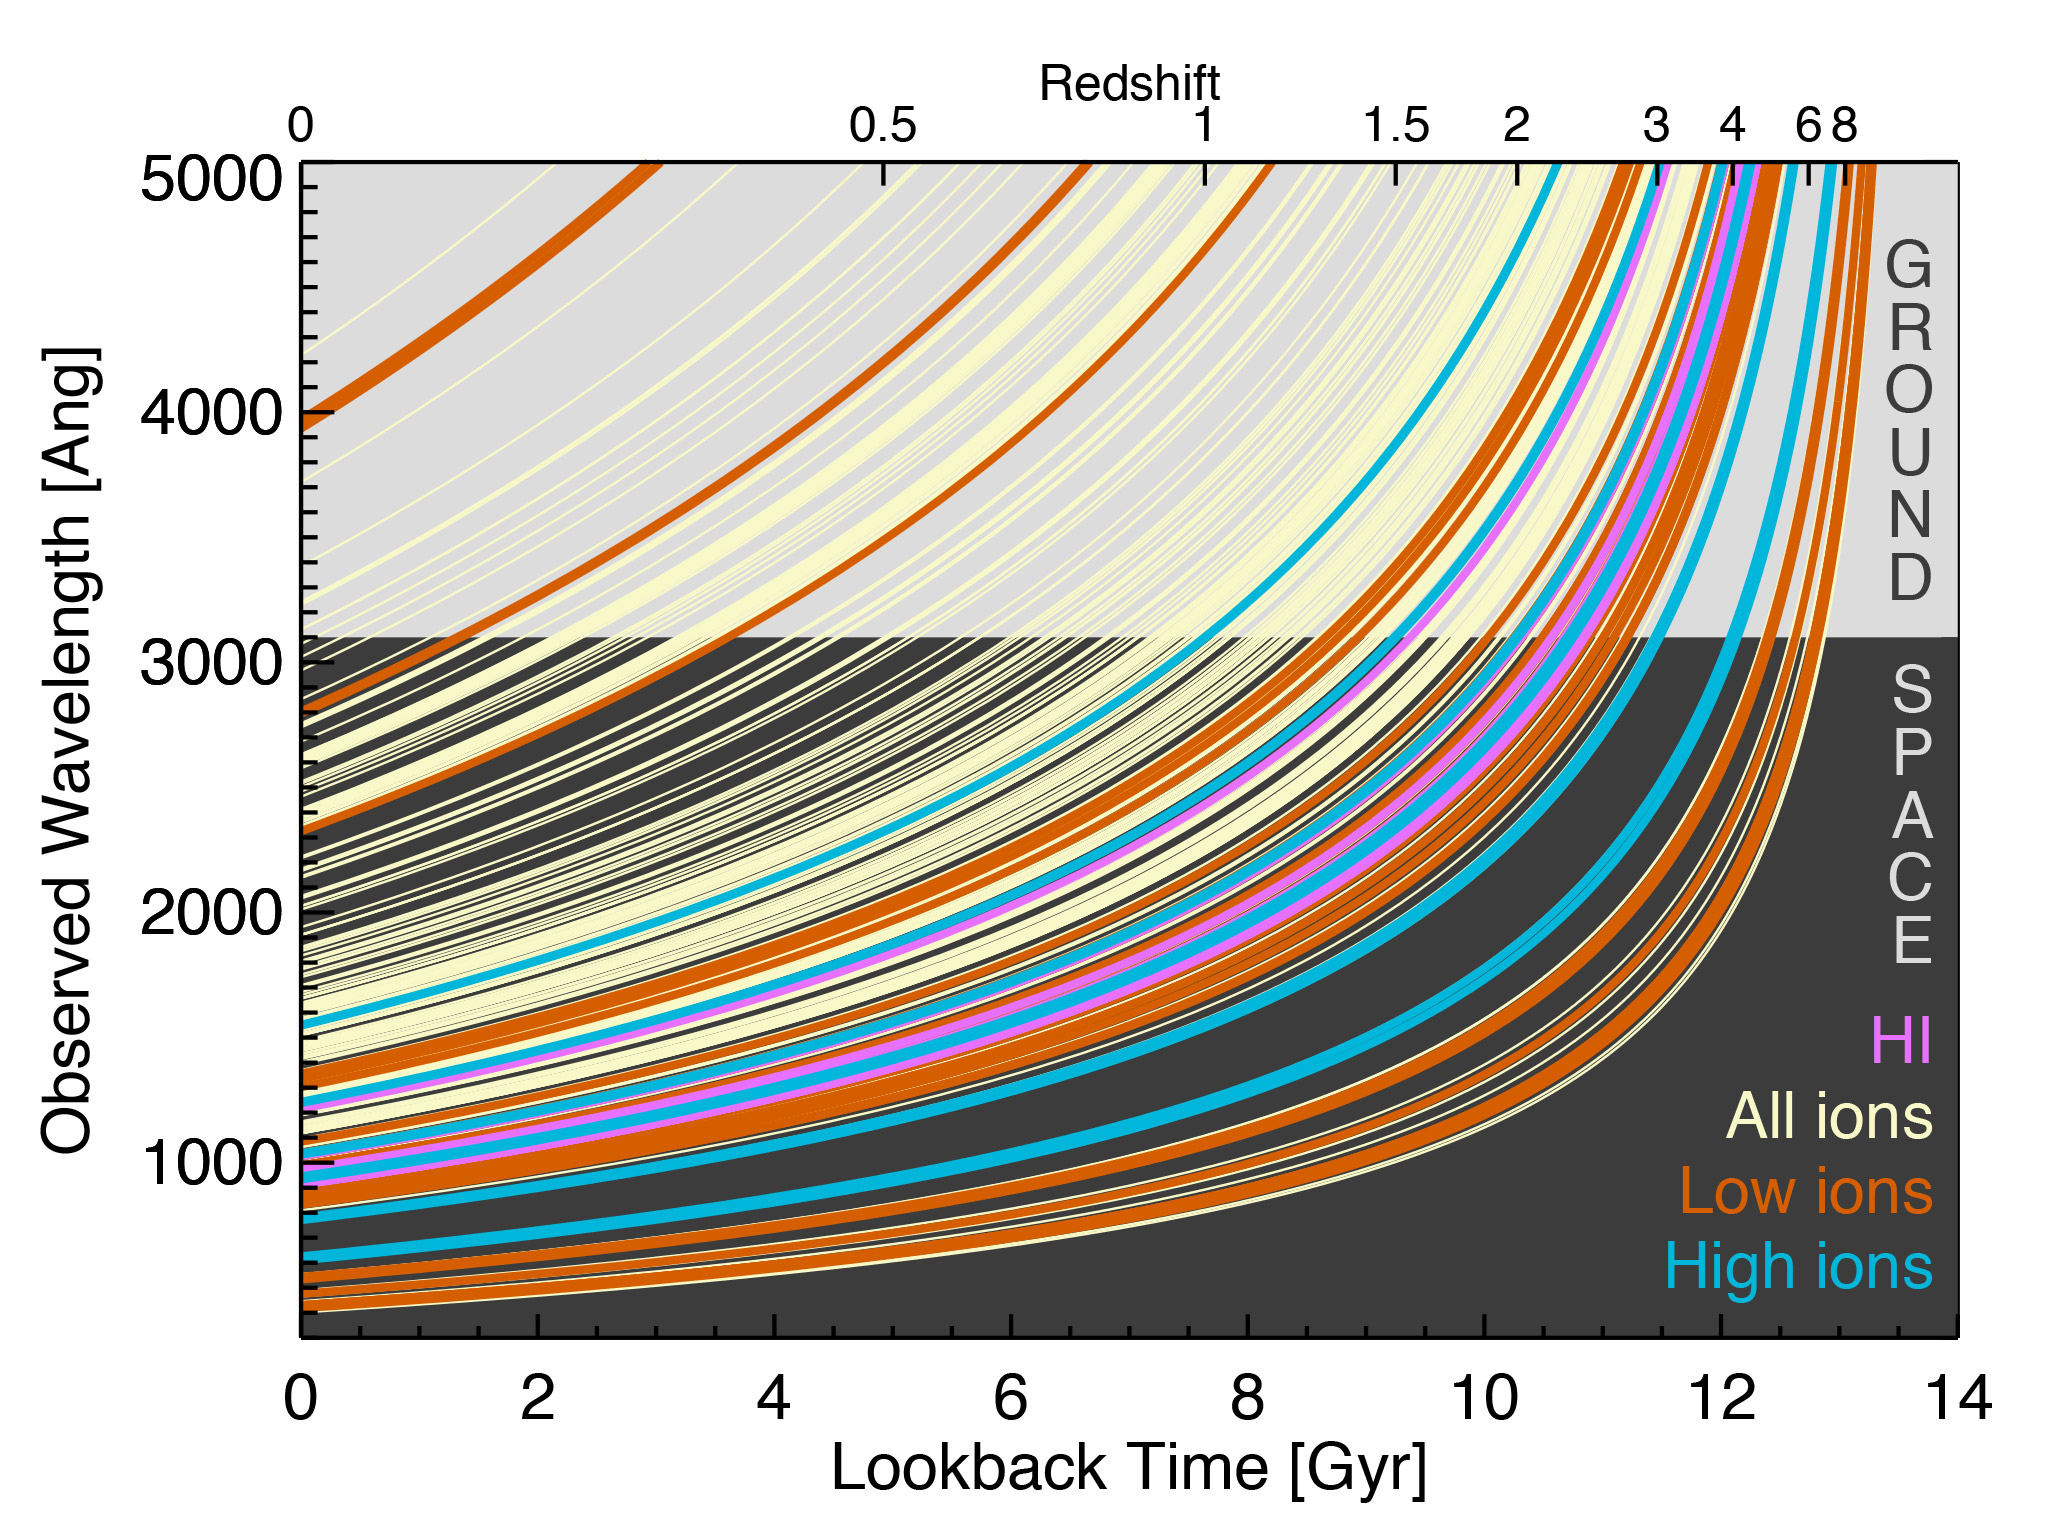
Figure 4-8
The availability of physical line diagnostics versus lookback time and redshift. Rest wavelengths are marked where lines touch the axis at left (z = 0). The line density of available diagnostics increases sharply toward the rest-frame UV. All the important diagnostics of H I (magenta) and hot and/or high ionization gas (blue) lie in the UV at 8–12 Gyr lookback time, and do not cross the 3100 Å atmospheric cutoff until z ≳ 1.5–2. While a few low-ionization lines (orange) are available from the ground at low redshift, over most of cosmic time the measurement of physical conditions and elemental abundances in multiphase gas and stellar populations requires access to observed-frame UV wavelengths.
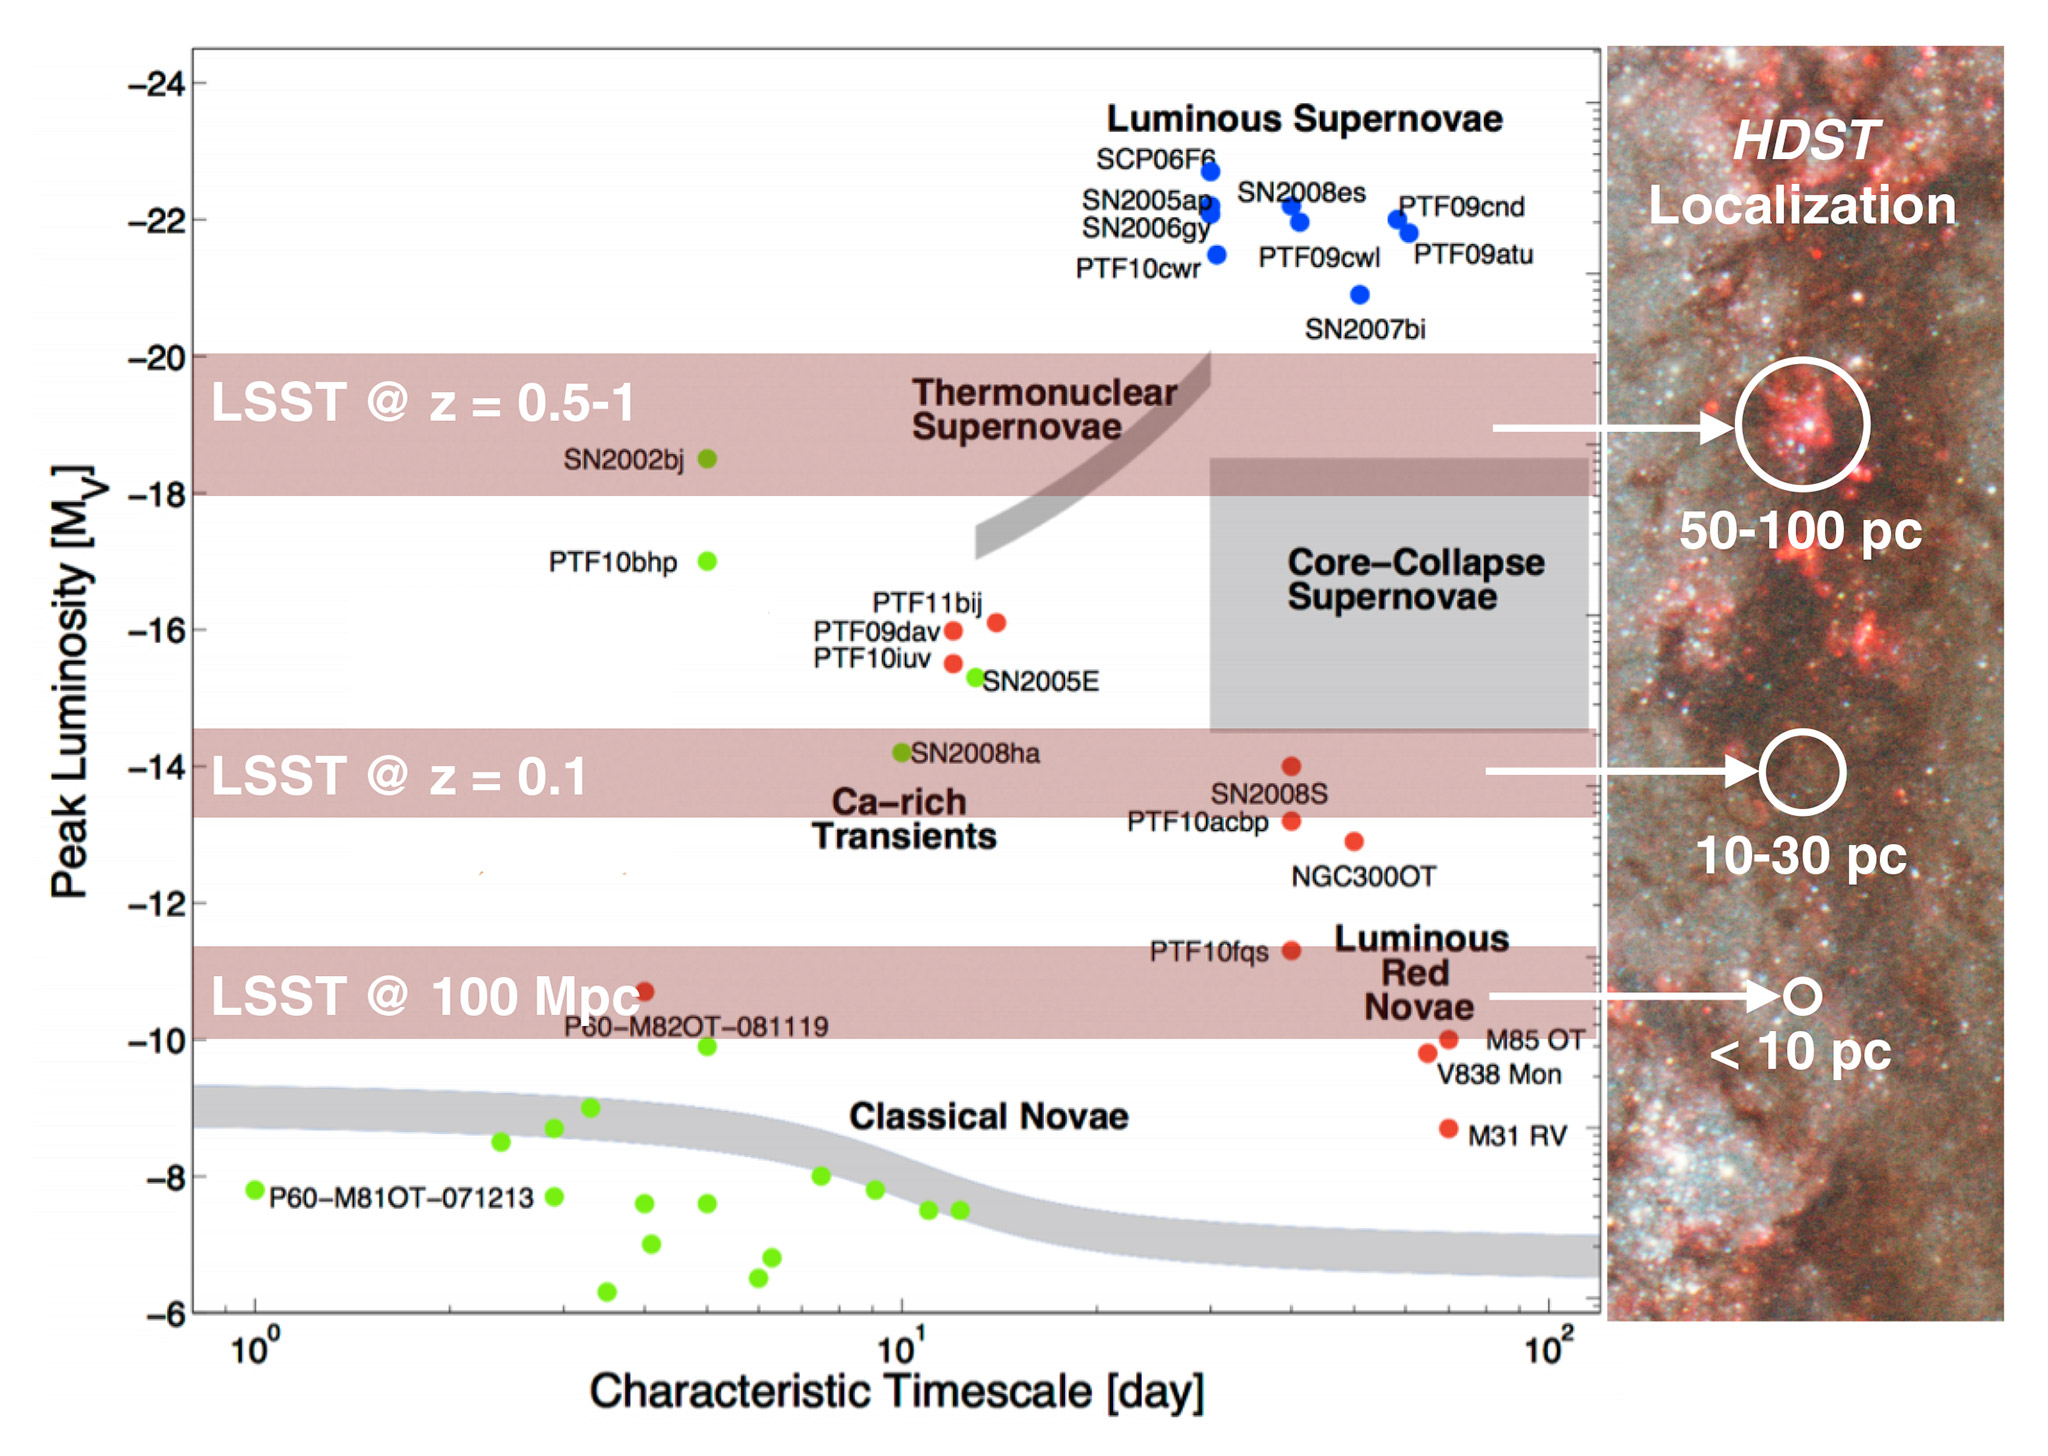
Figure 4-9
The energy/timescale parameter space for the transient sky. In single-night visits, LSST will reach events at the luminosity limits shown by the pink bands, e.g., events at Mv ~ –19 will be detected out to z = 0.5–1, and HDST will localize these events to within 50–100 parsec precision within their host galaxies. Localization becomes 10 parsec or better, the size of a single molecular cloud region, for events detected out to 100 Mpc. Credit: M. Kasliwal (Caltech).
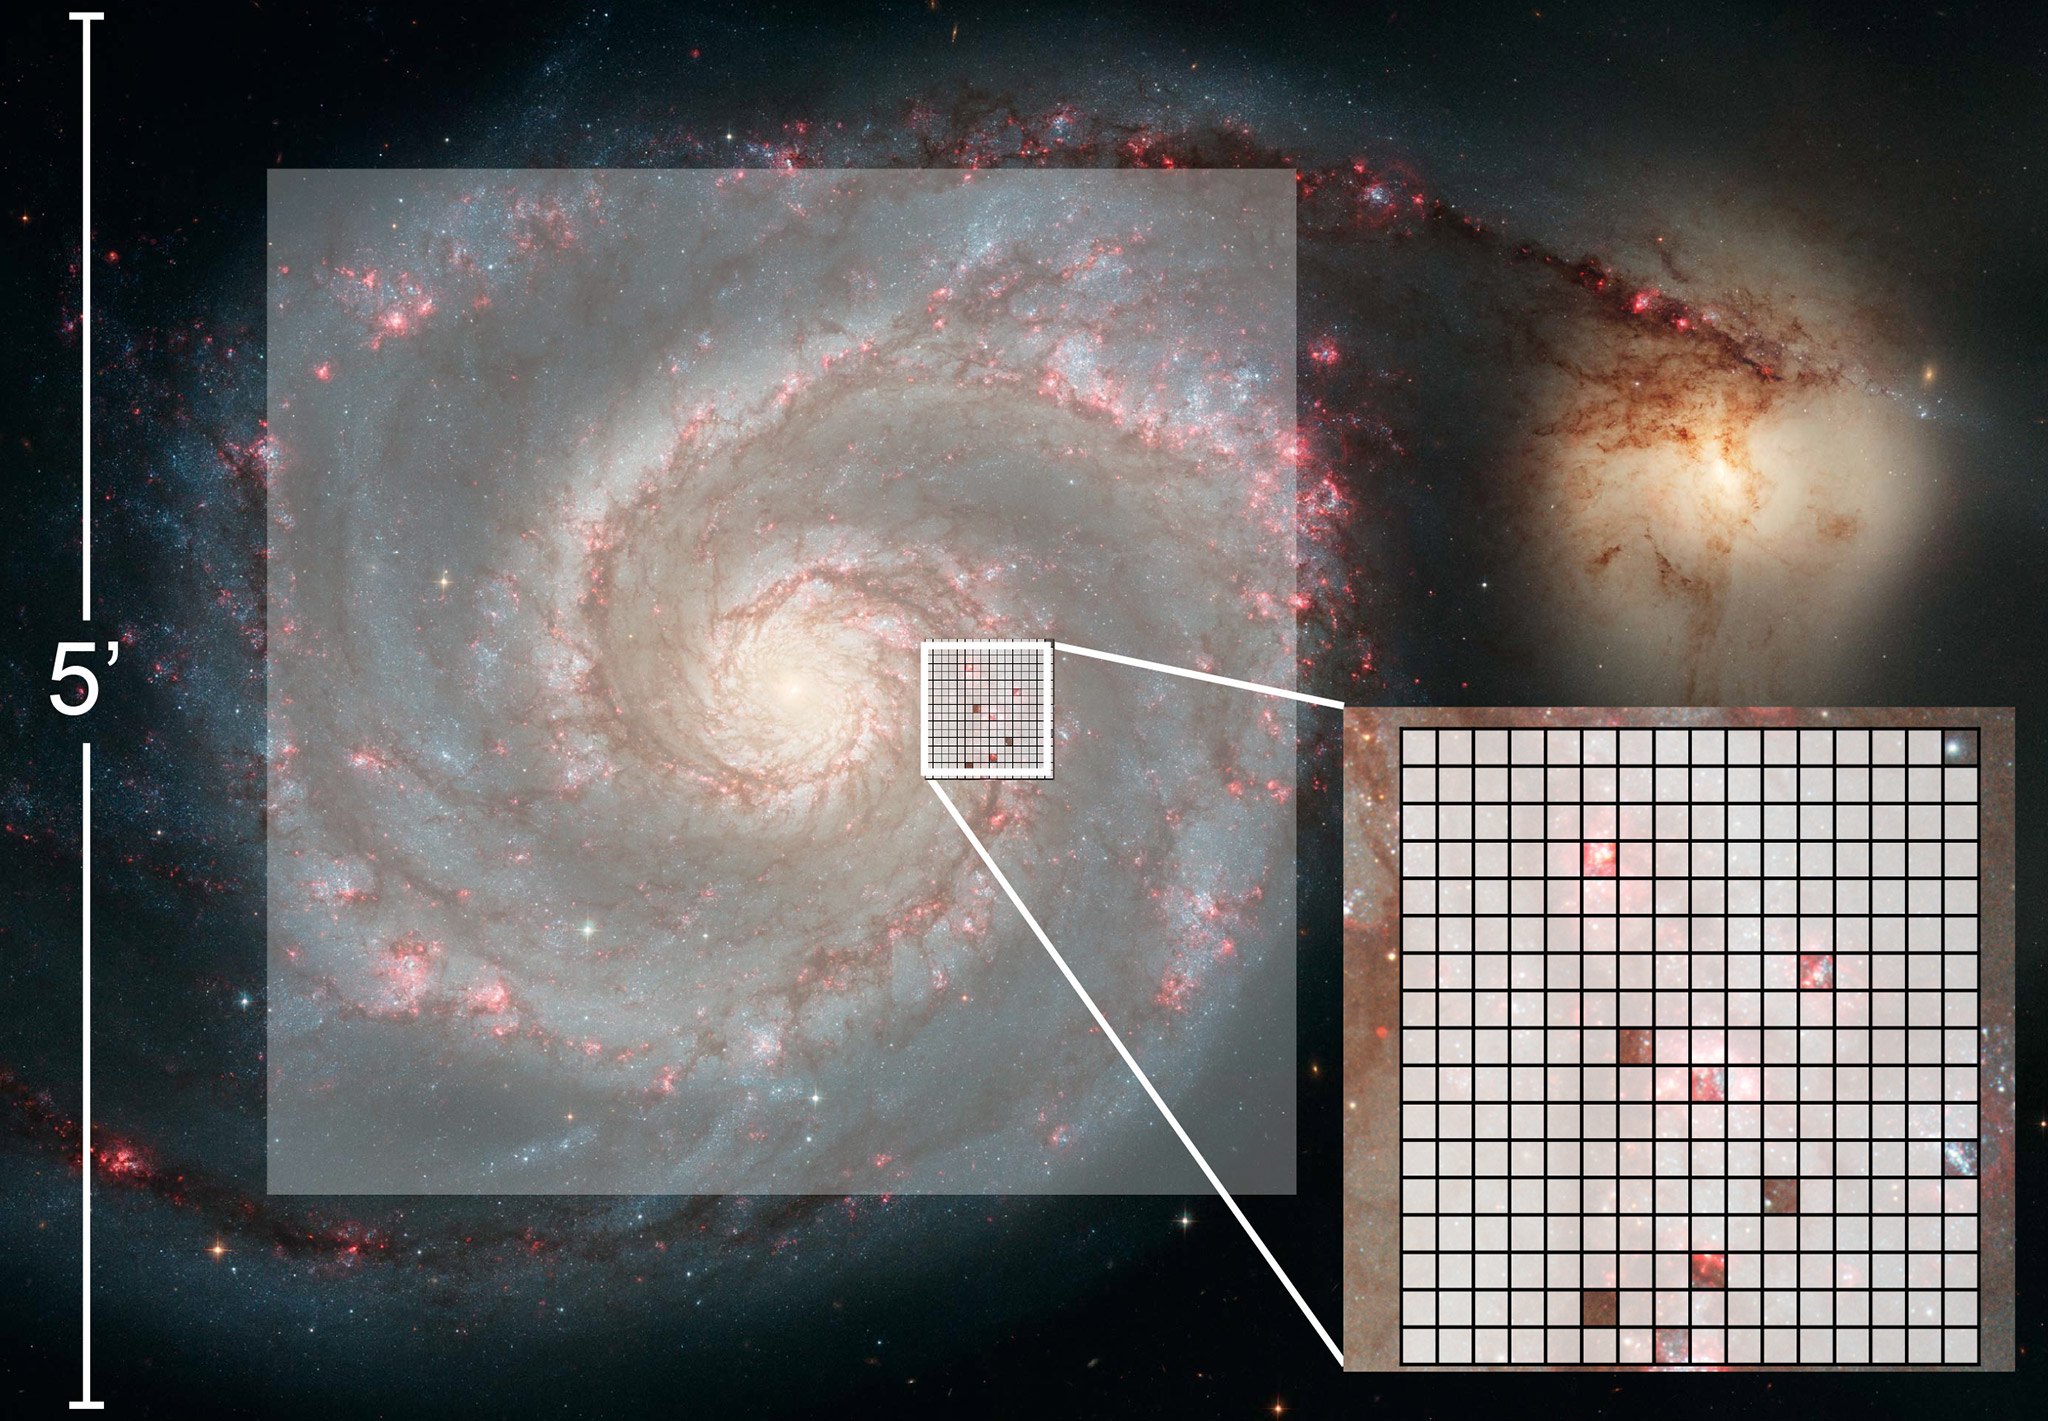
Figure 4-10
Dissecting galaxy outflow and inflow requires UV multi-object spectroscopy. A UV MOS mode with 50–100 objects observable at once in a 3–5' FOV will enable efficient studies of young stellar clusters, ISM gas, and energetic feedback for thousands of clusters in dozens of galaxies in the nearby Universe. Together with star-formation histories and halo gas, these observations will dissect the past evolution and current activity of nearby galaxies. This capability will also enable intensive studies of the circumgalactic medium, young stars in Galactic clusters, and many other frontier science problems.
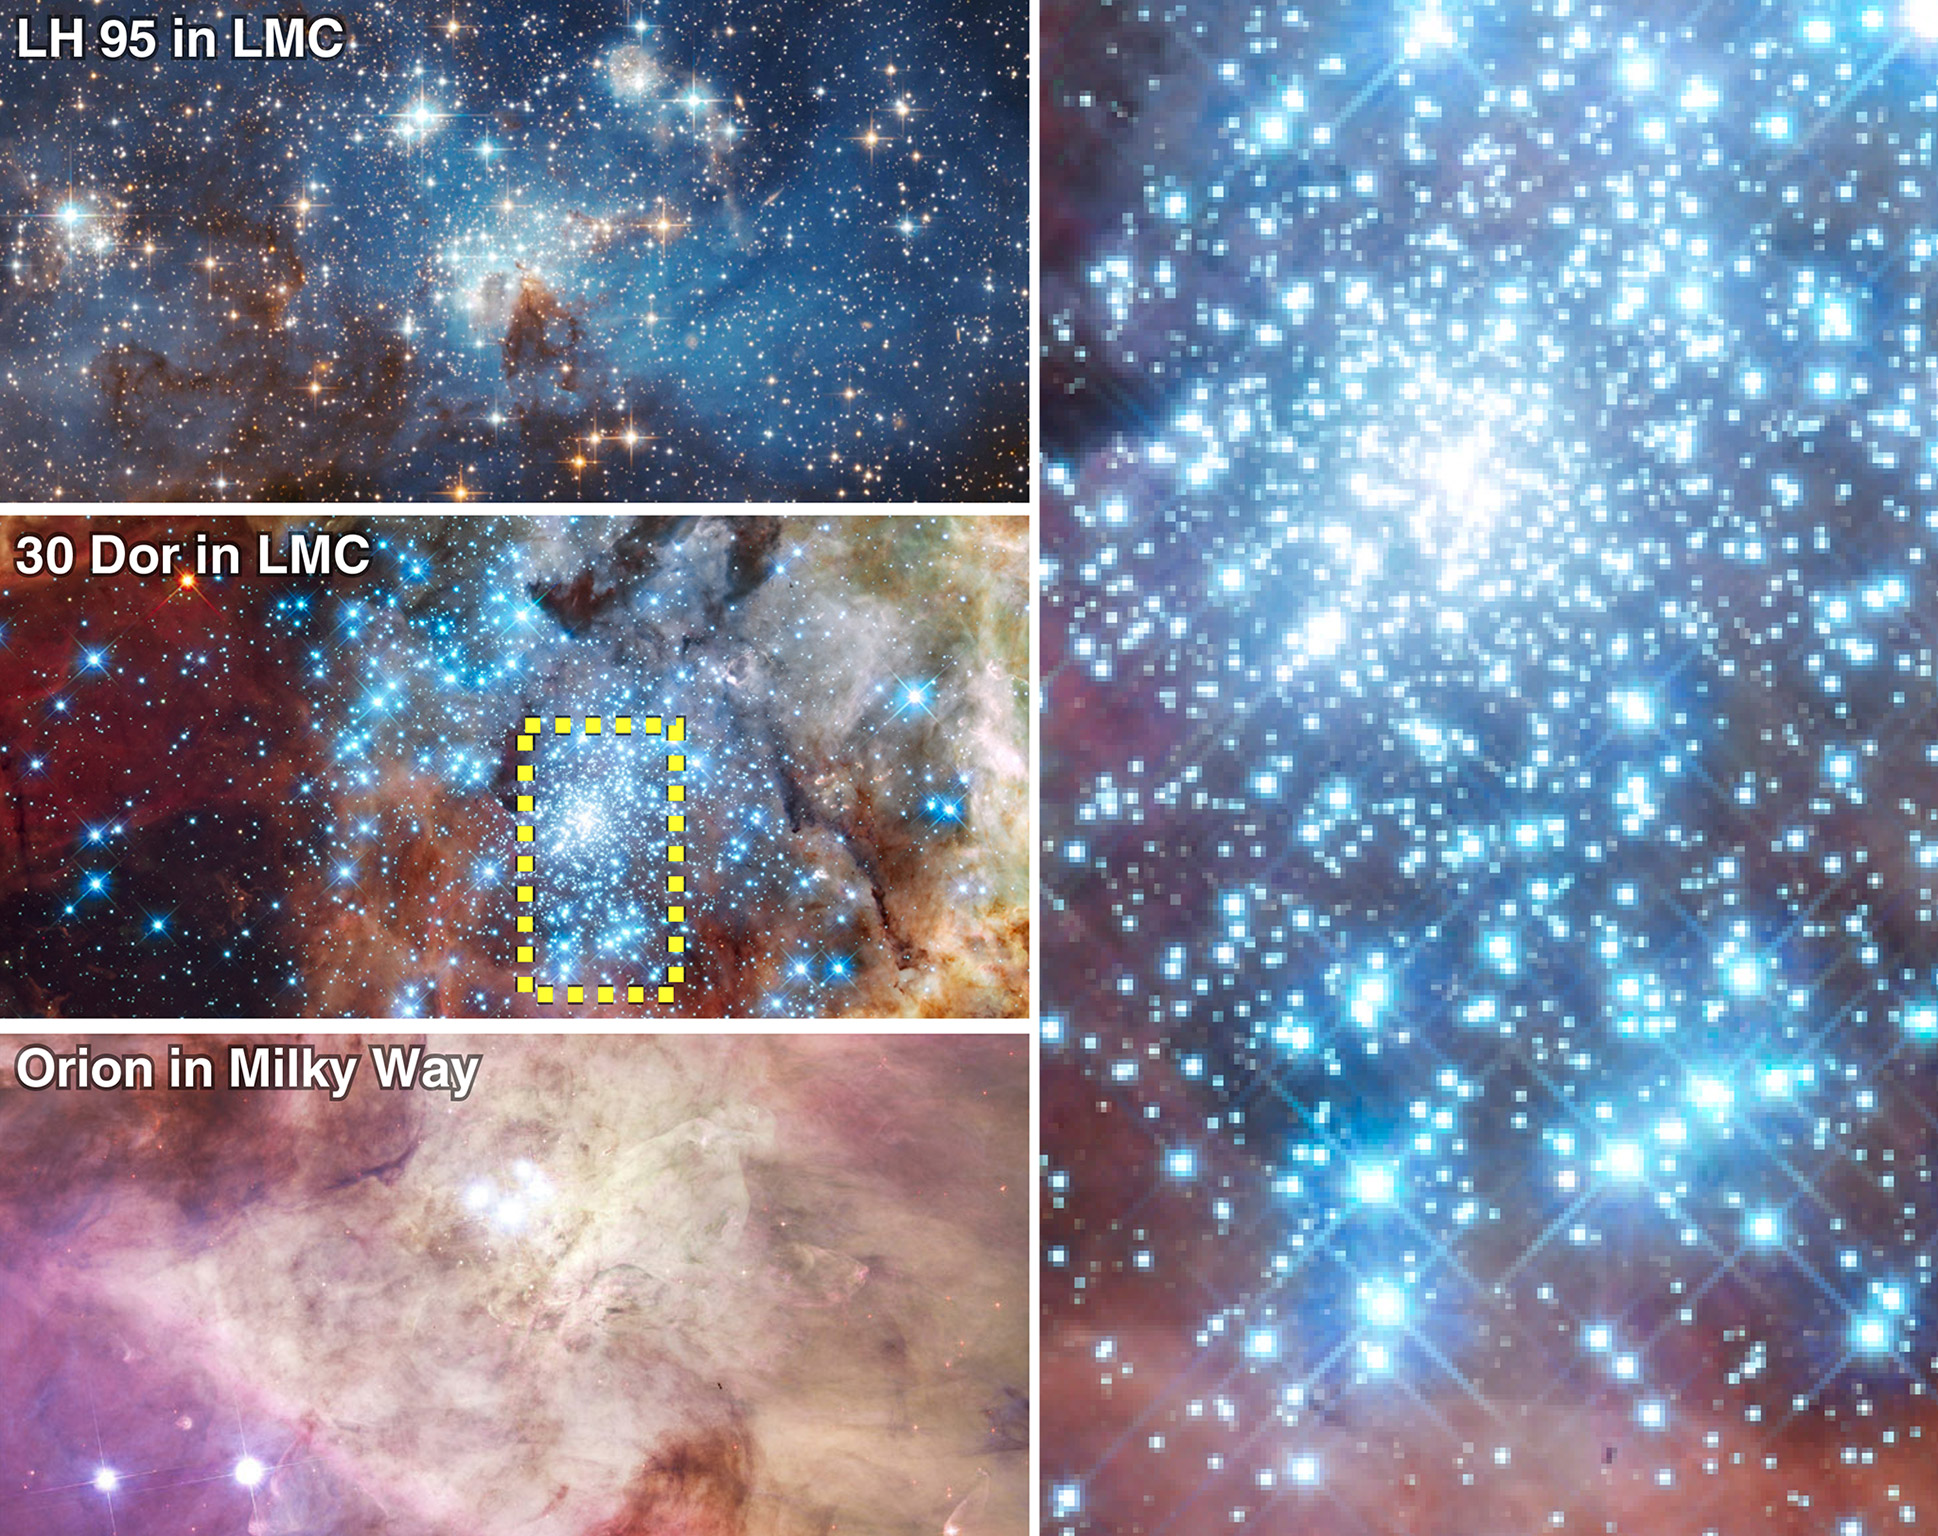
Figure 4-11
Most stars form in clusters like these. Hubble can resolve individual stars in the nearest massive star-formation region to Earth (Orion, at bottom). As shown in the zoom-in panel at right, dense clusters in the low-metallicity Magellanic Clouds, which better resemble conditions in the early history of the Milky Way, cannot be resolved into individual stars for star-count IMFs or UV-derived mass-accretion rates. HDST will fully resolve such clusters and directly measure the shape and causes of the IMF in these chemically primitive environments.
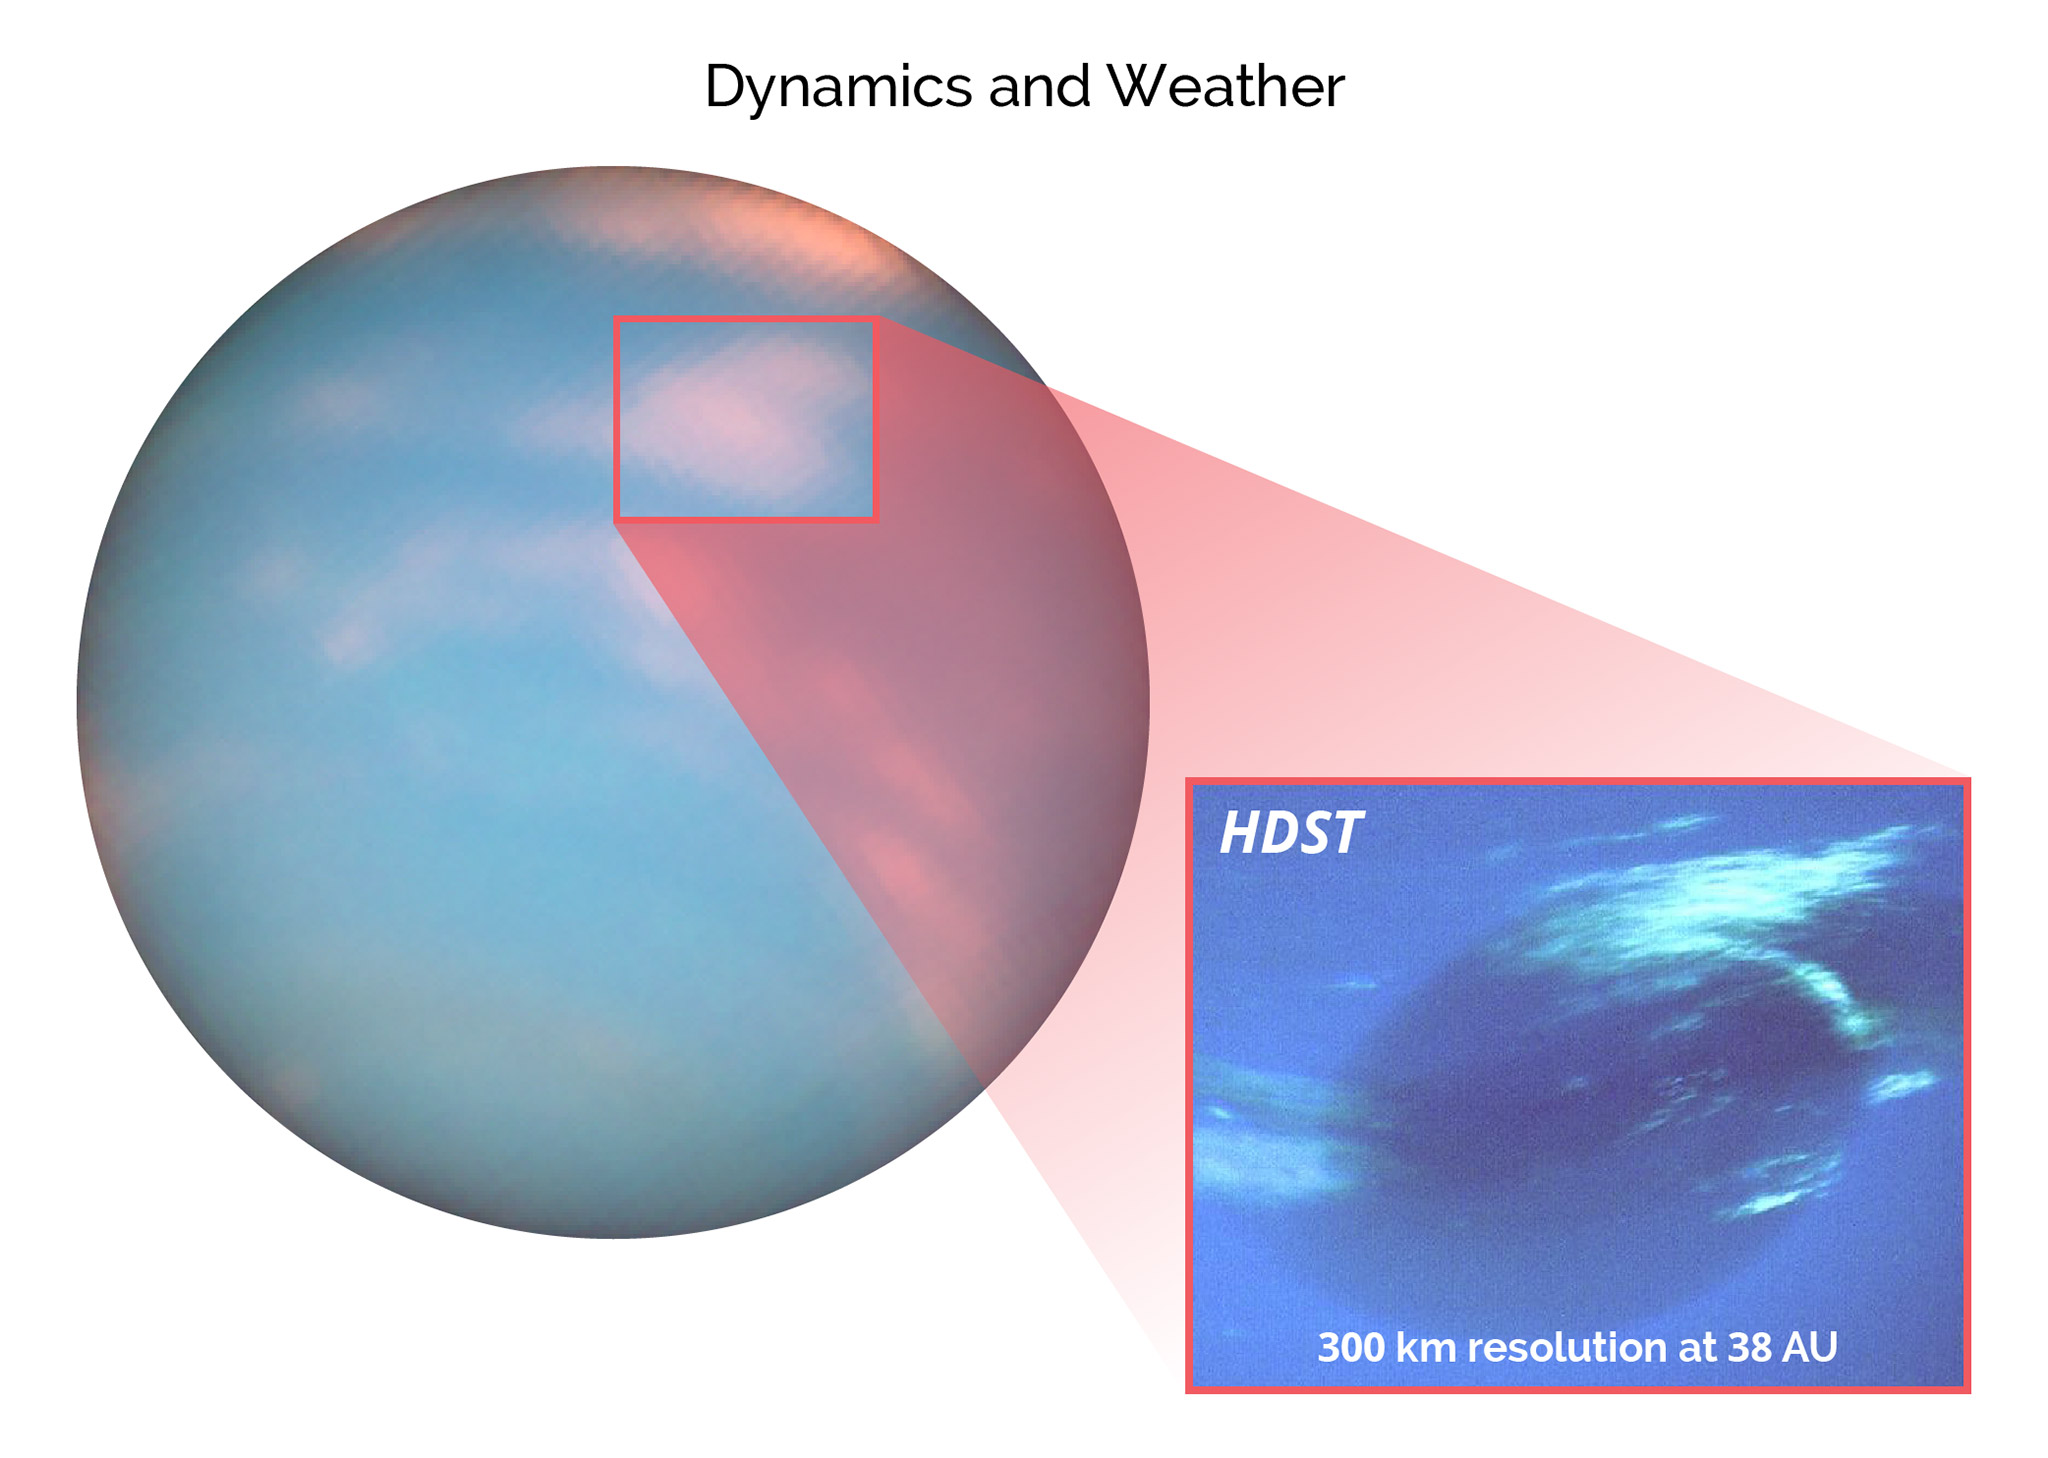
Figure 4-12
A visualization of HDST’s imaging performance for weather and atmospherics dynamics in the outer planets. This example using Neptune shows that HDST will resolve cloud patterns with 300-km resolution.
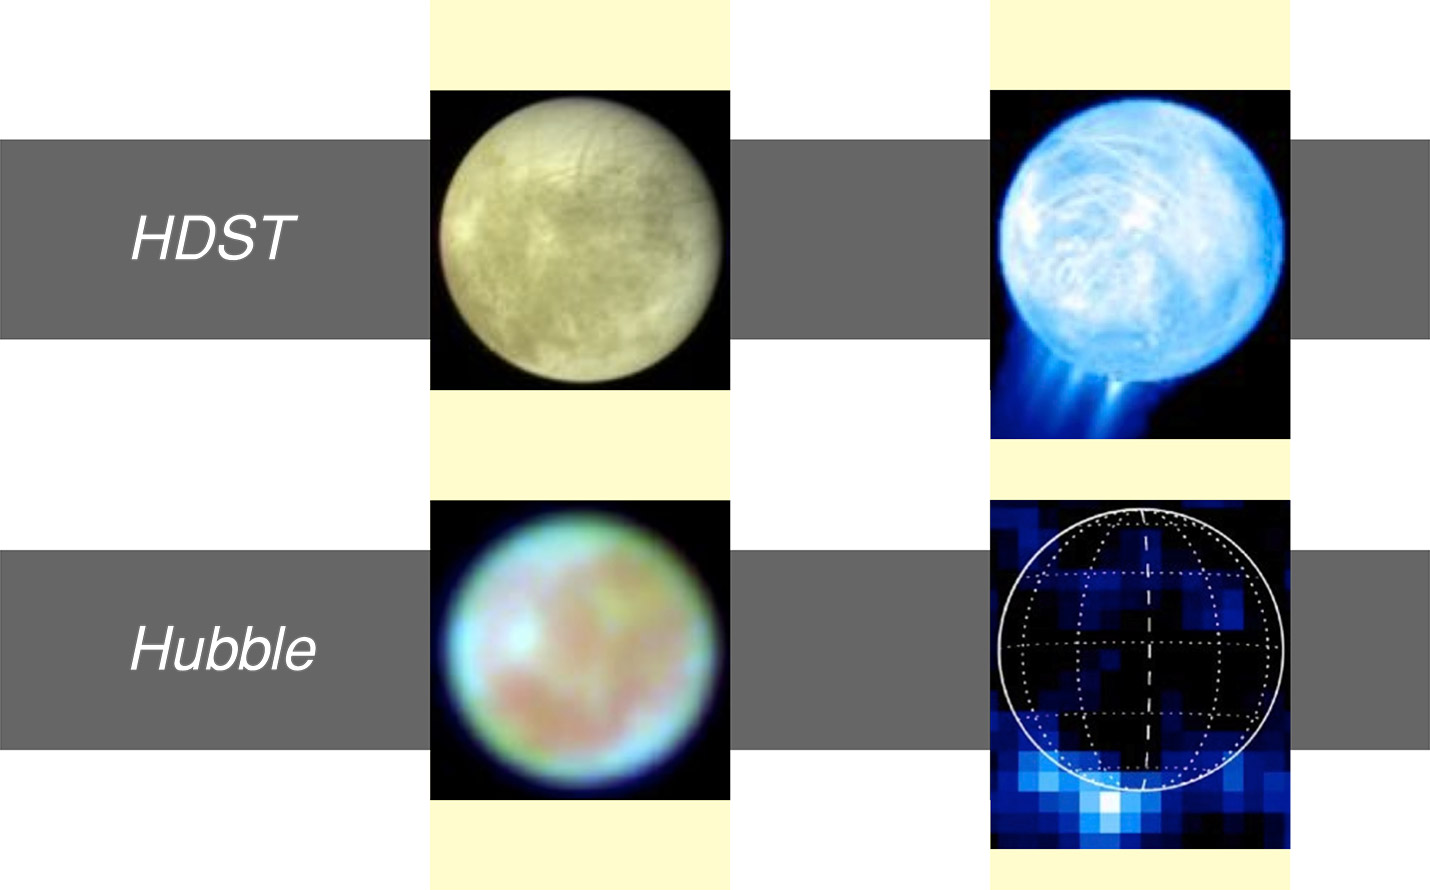
Figure 4-13
Two views of the Galilean satellite Europa, including visible band images at left and UV-band emission-line images of water vapor ejecta with Hubble/STIS and re-simulated at HDST resolution. At the orbit of Jupiter, HDST’s spatial resolution is 35 km.
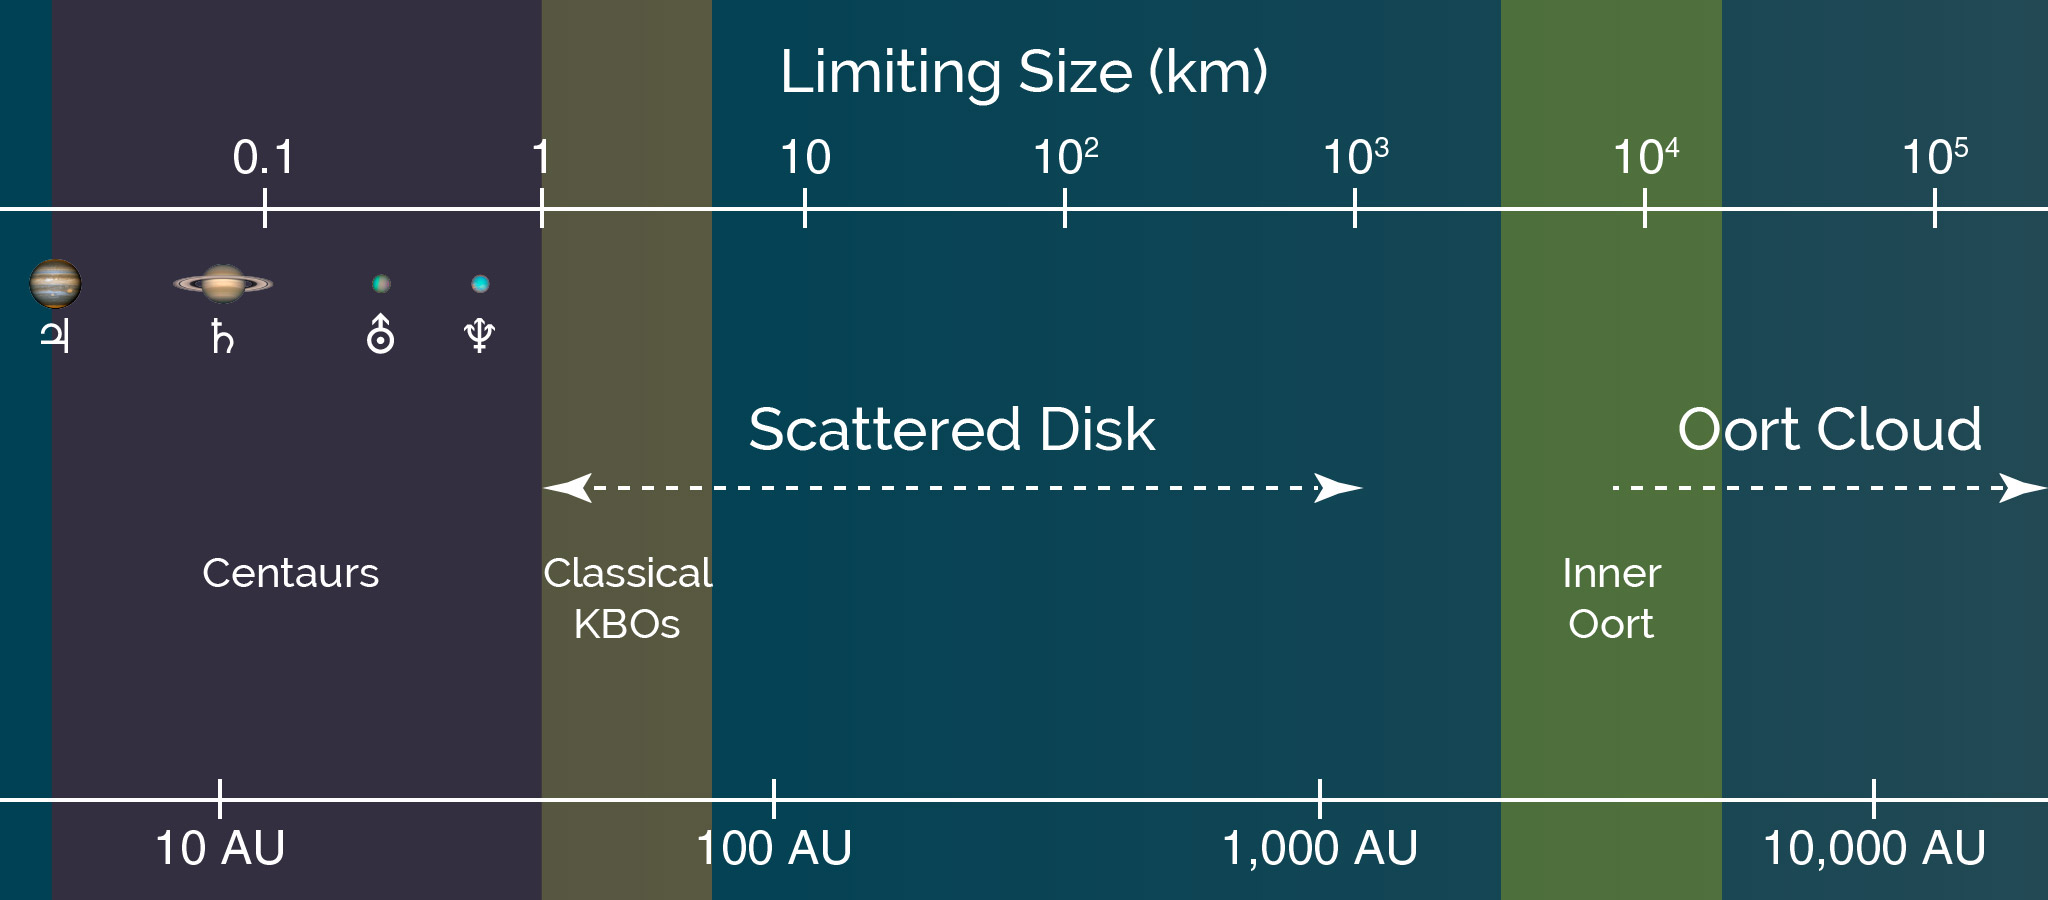
Figure 4-14
The minimum size detection limit (in km) for Kuiper Belt Objects and Trans Neptunian Objects at various heliocentric distances extending into the inner Oort cloud. The limits provided assume a 4% albedo and negligible contribution from thermal emission.
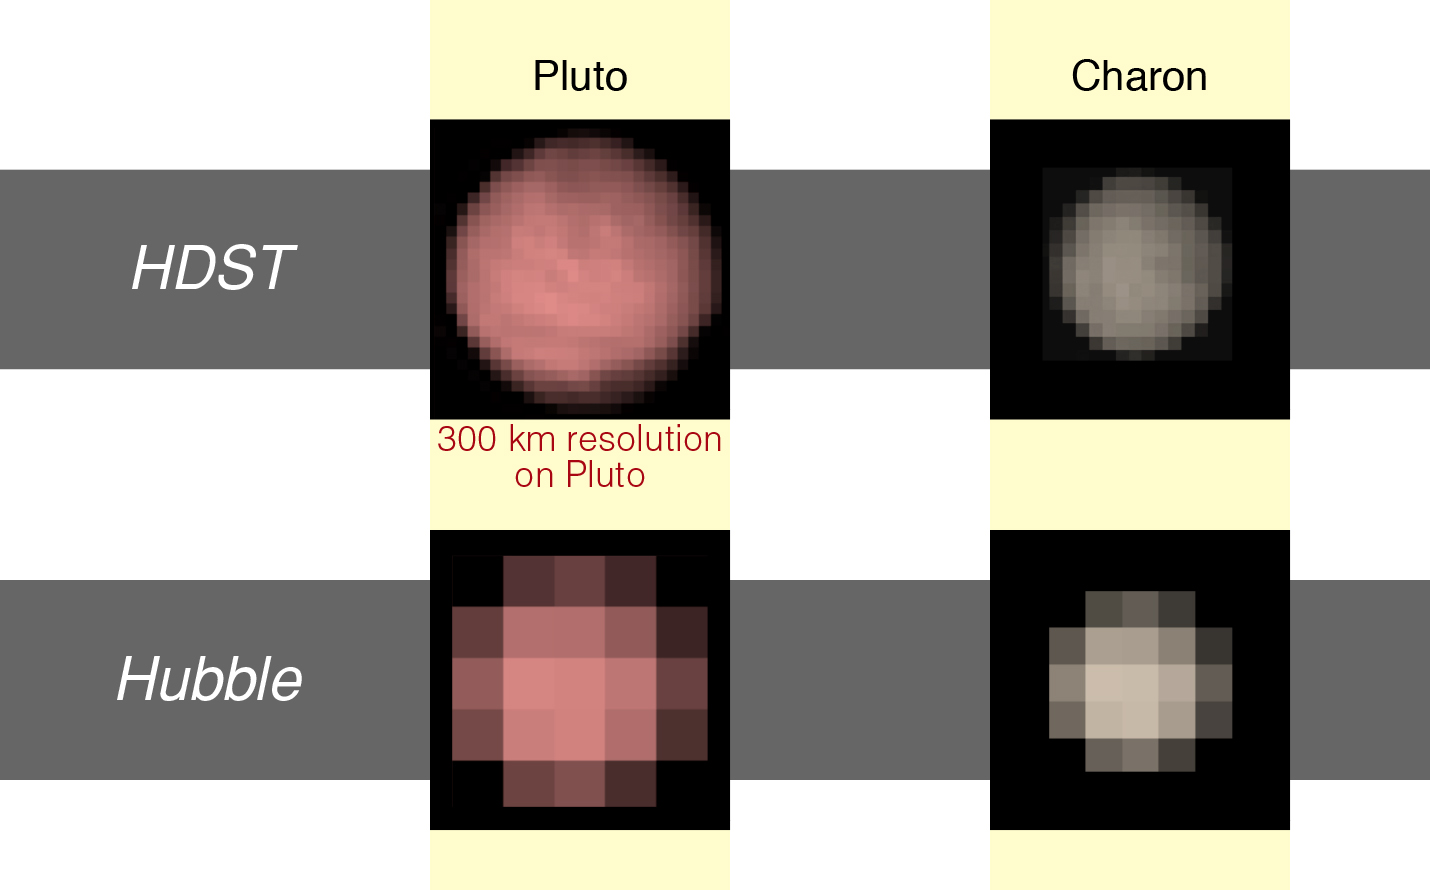
Figure 4-15
Two views of Pluto and Charon. At bottom, Hubble images that span the two bodies by only a few pixels. At top, a simulated HDST views that resolves surface features as small as 300 km.
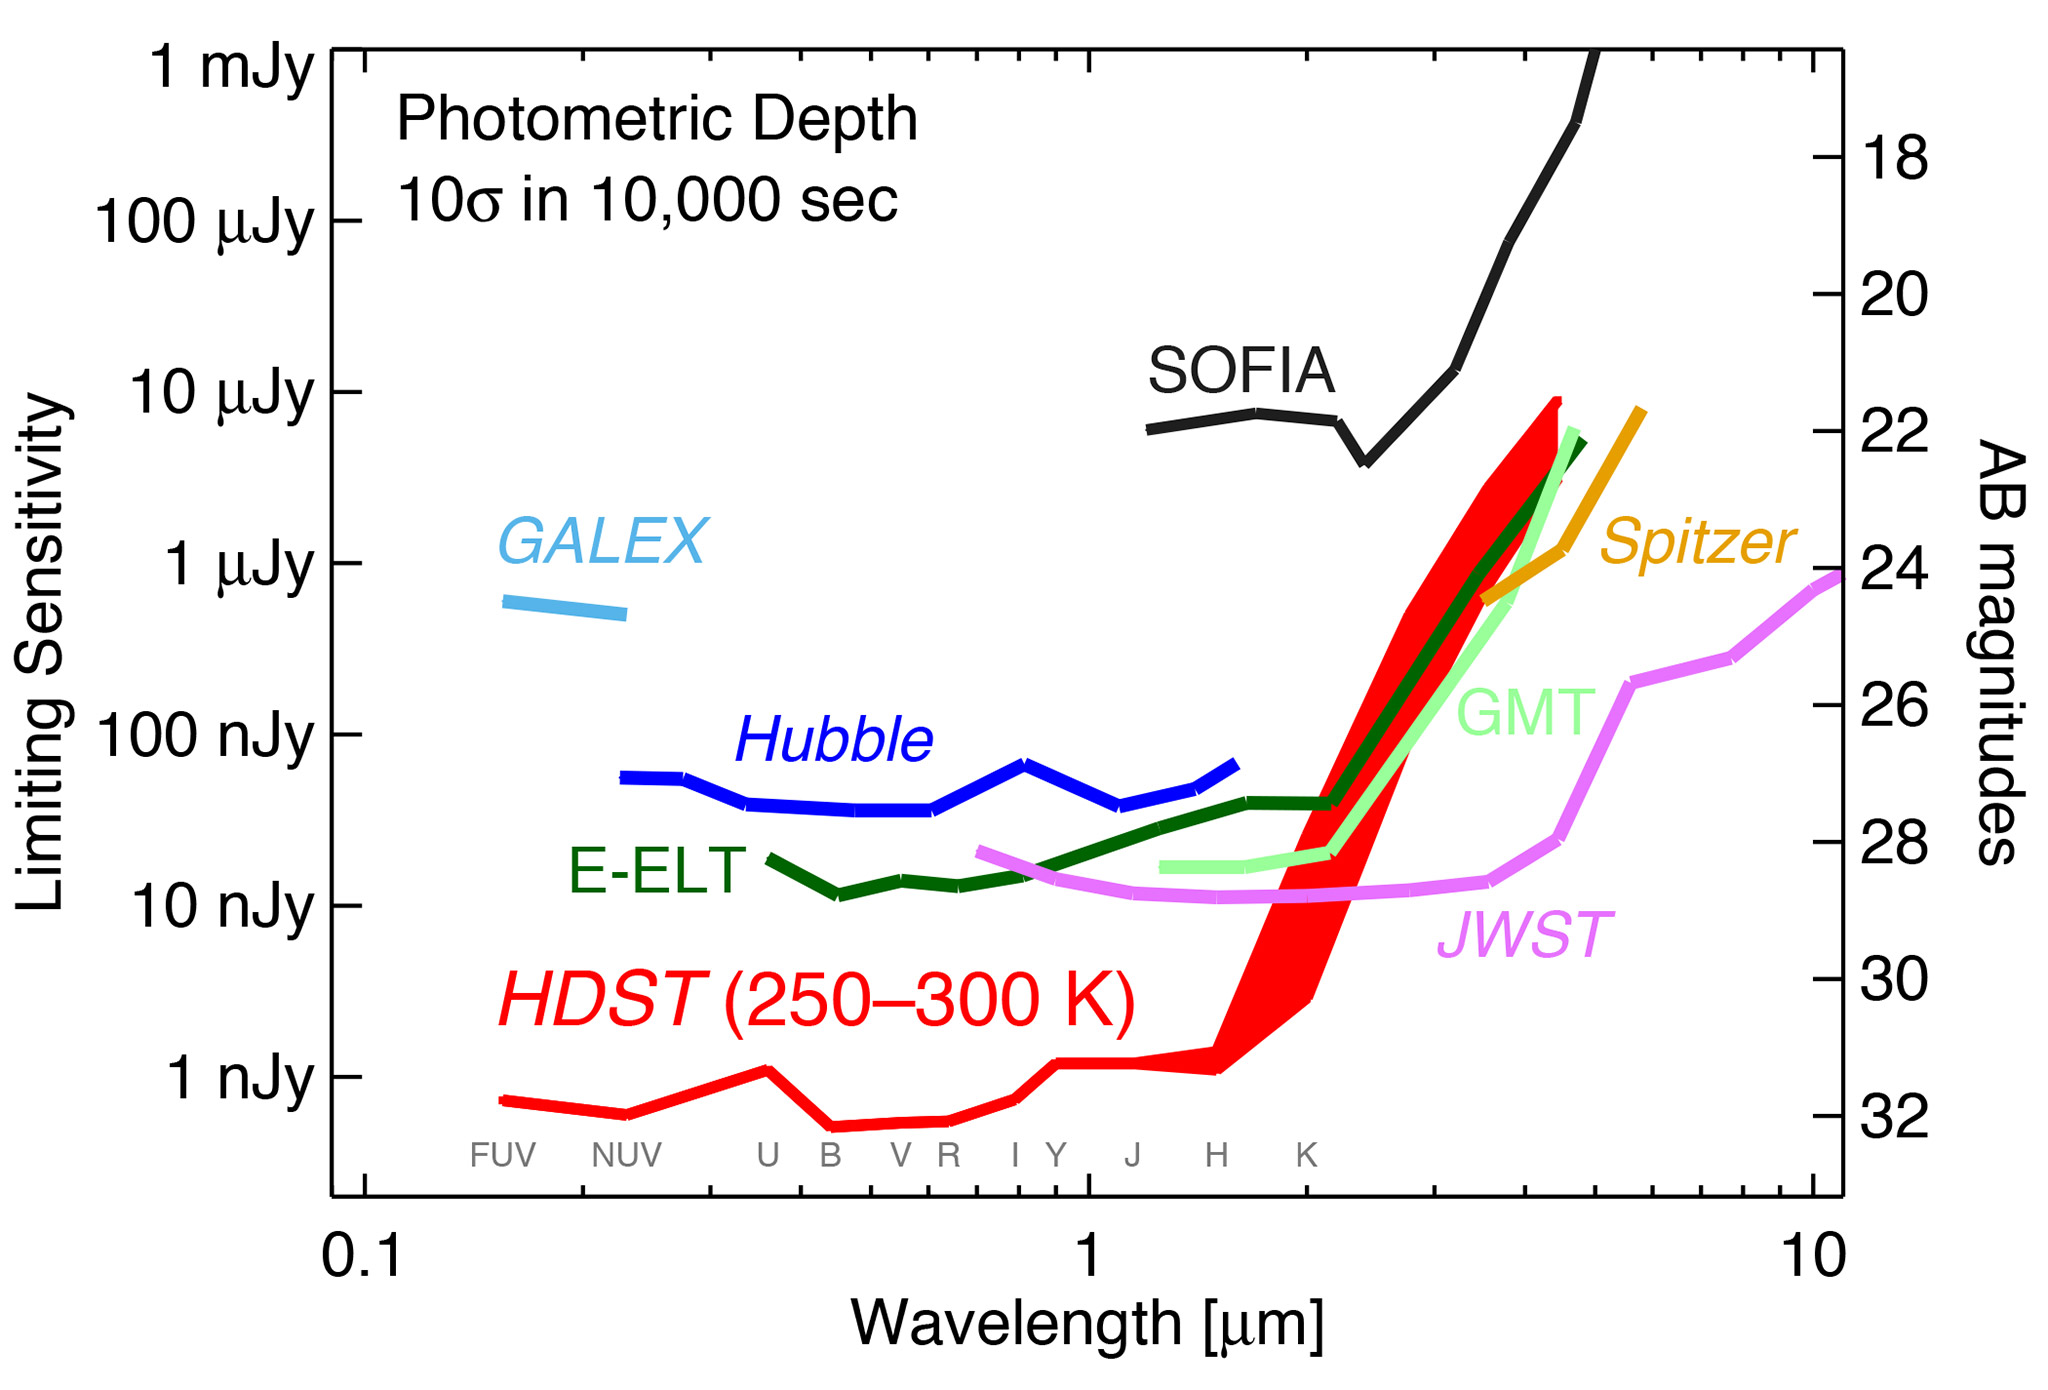
Figure 4-16
The 10-sigma limiting sensitivities as a function of wavelength are shown for various facilities in the near-IR and mid-IR for a 10 ksec broadband imaging integration. HDST sensitivities are shown for two different operating temperatures. Even without operating at cryogenic temperatures, HDST is competitive with JWST and the ELTs at wavelengths of less than 2 microns, and with Spitzer at longer wavelengths.
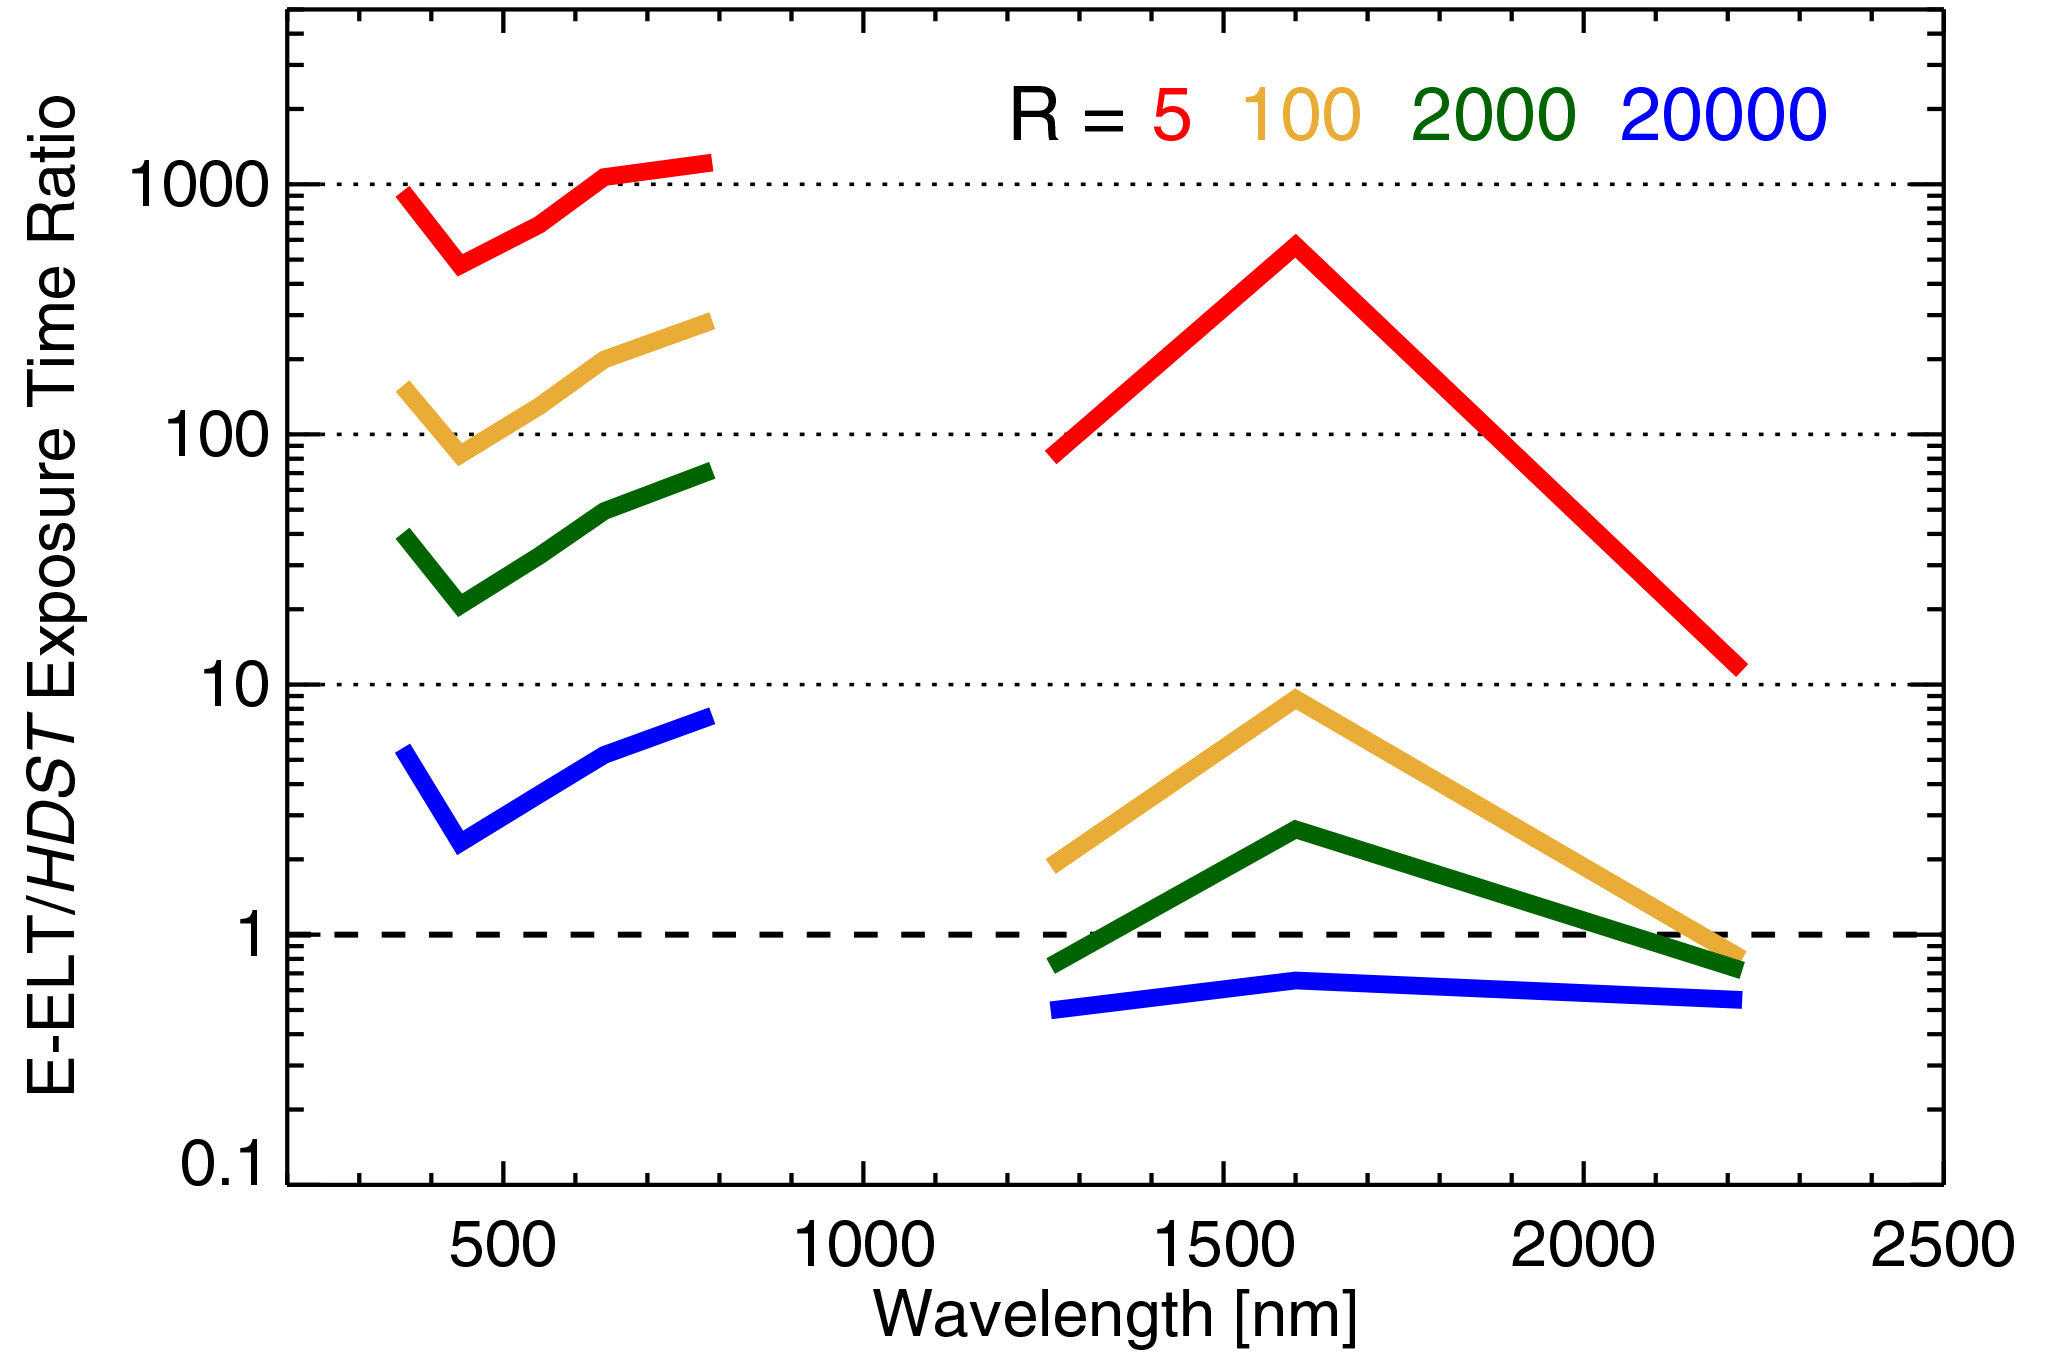
Figure 4-17
The ratio of integration time needed to reach an SNR = 10 on a 38 m E-ELT to that needed on HDST as a function of wavelength for point sources. Four different spectral resolutions (R = 5, 100, 2000, and 20,000) are shown for sources with AB mag of 30, 28, 26.5, and 24, respectively.
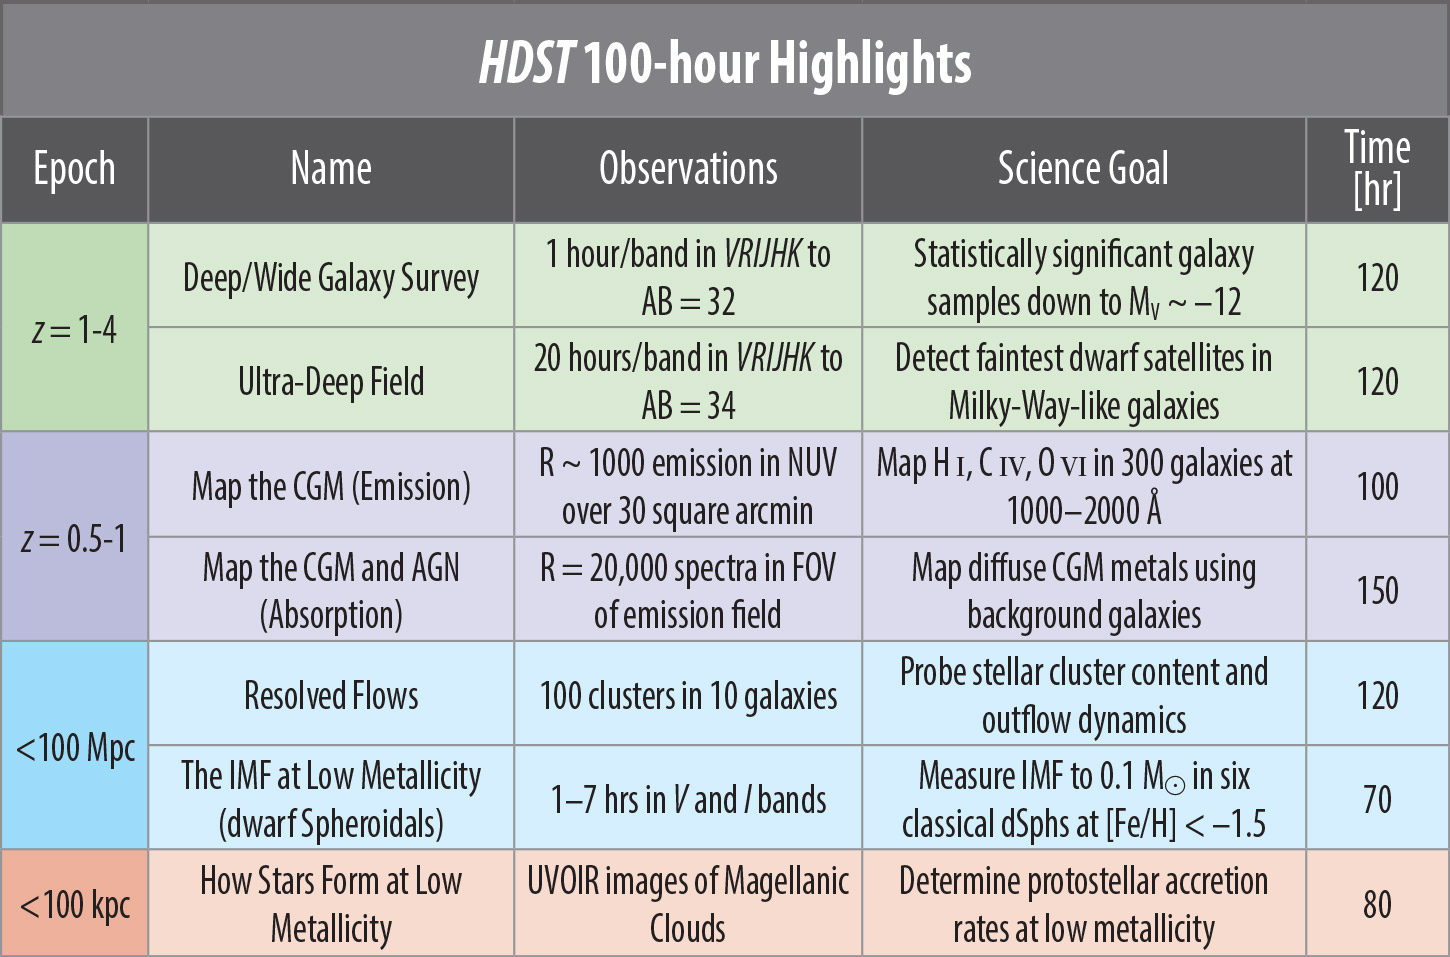
Table 4-1
Conceptual Astrophysics Treasury Programs with HDST